
Life expectancy can be affected by a variety of factors. About 25% of your lifespan is determined by genetics, according to the National Library of Medicine. Health and wellness habits—like following a balanced, nutrient-rich diet; not smoking; drinking minimal alcohol; maintaining a healthy weight; and staying physically active—can add more than a decade to your life, research from the National Institutes of Health shows. While these factors are significant, another important element that you might not have considered is your environment and community.
While life expectancy generally increases annually in the United States—jumping from about 70.8 years old to 77.5 between 1970 and 2022, according to the Centers for Disease Control and Prevention—this particular metric can vary from state to state or even county to county. In some parts of the country, the average lifespan is getting shorter based on a variety of risk factors on top of health, including socioeconomic factors like poverty, unemployment, income, and education.
According to a 2020 study from researchers at Penn State, West Virginia, and Michigan State Universities, communities with a higher population density, more fast food restaurants, and a high number of extraction industry-based jobs tend to have shorter life expectancies.
To find out how life expectancy varies within Georgia, Stacker used 2024 County Health Rankings & Roadmaps from the University of Wisconsin Population Health Institute to identify the counties with the shortest life expectancy. Life expectancy measures the average number of years from birth a person can expect to live and is calculated based on the number of deaths in a given time period and the average number of people at risk of dying during that period. Counties with unreliable or insufficient data were excluded from the analysis. Mortality data came from the National Vital Statistics System.
Read on to see if your county is on the list.

Canva
#49. Coffee County (tie)
- Life expectancy: 72.4 years
--- 3.7 years lower than the state average
Canva
#49. Sumter County (tie)
- Life expectancy: 72.4 years
--- 3.7 years lower than the state average

Canva
#43. Muscogee County (tie)
- Life expectancy: 72.3 years
--- 3.8 years lower than the state average
Roberto Galan // Shutterstock
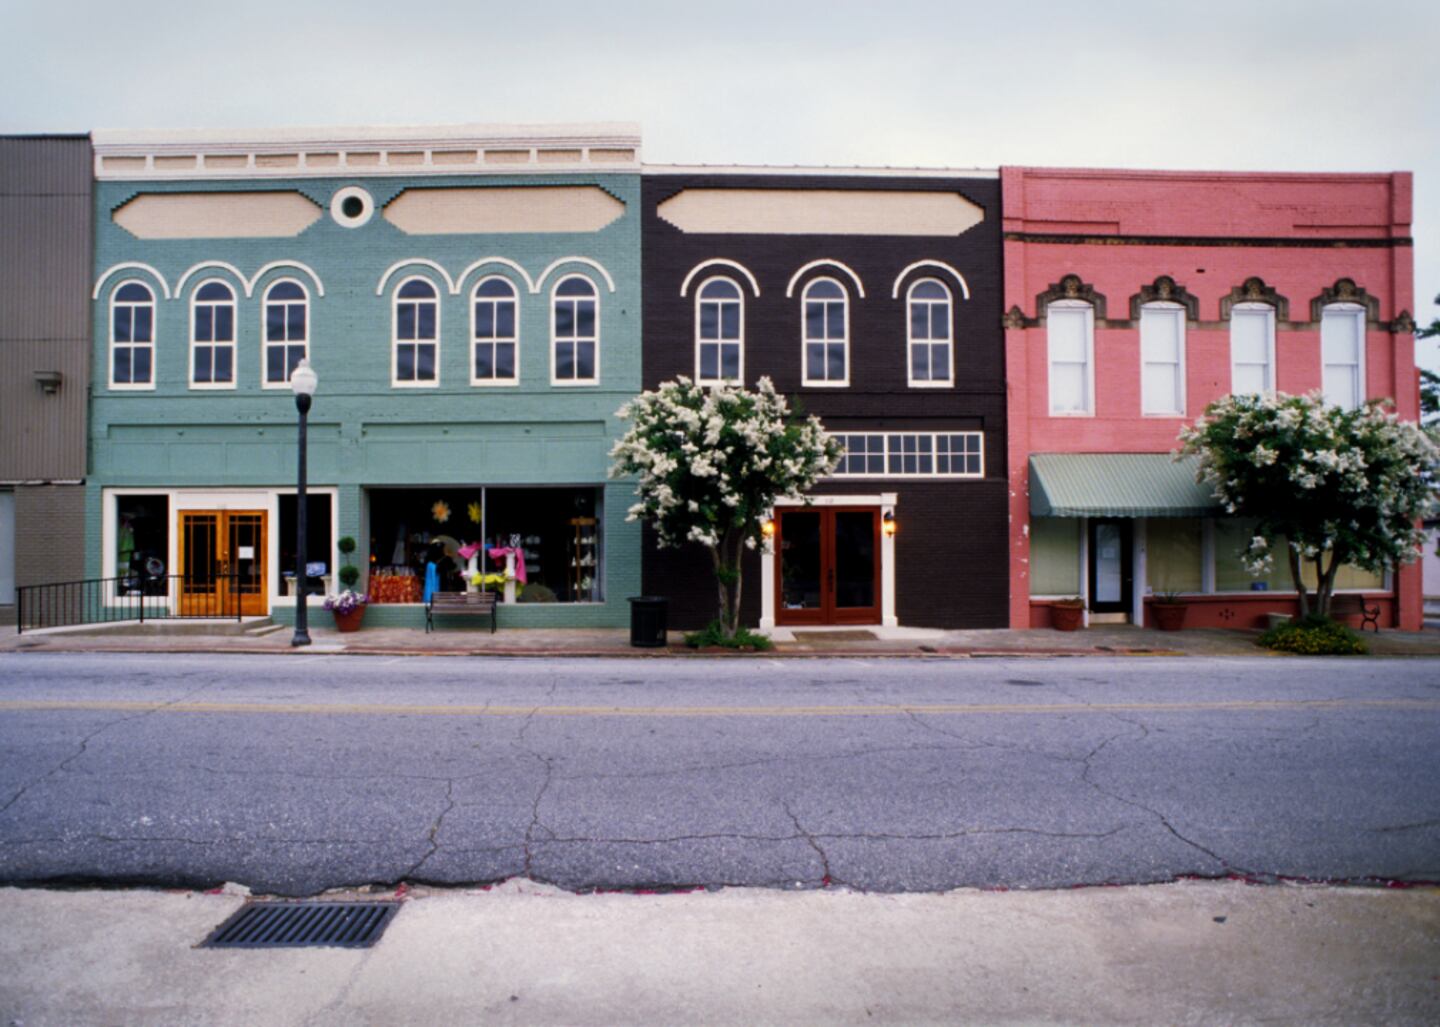
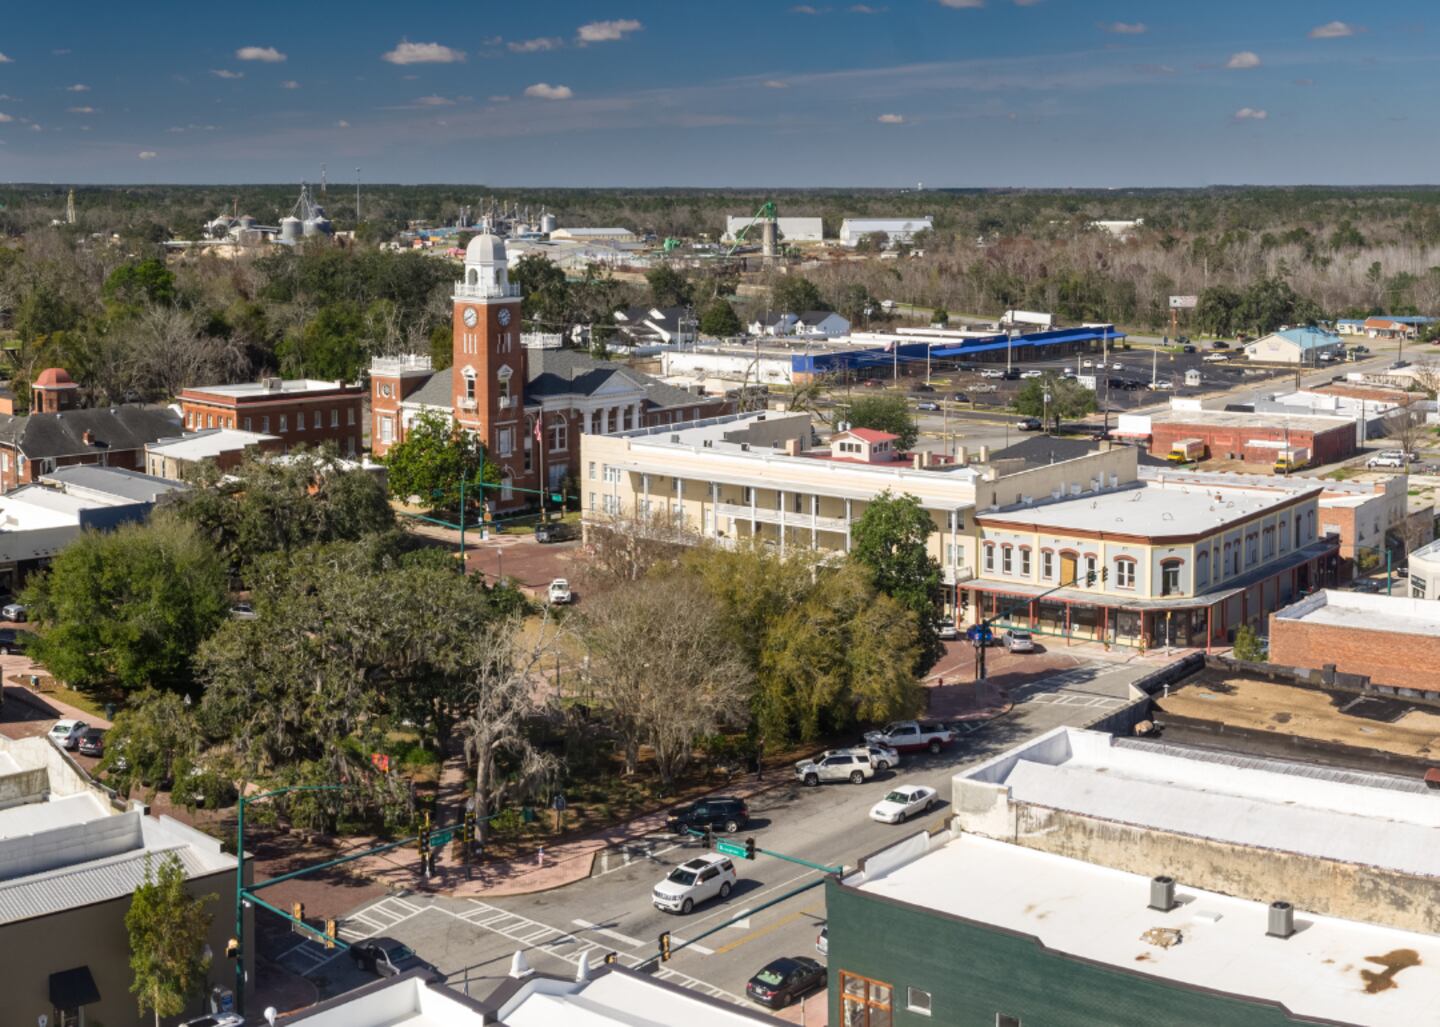
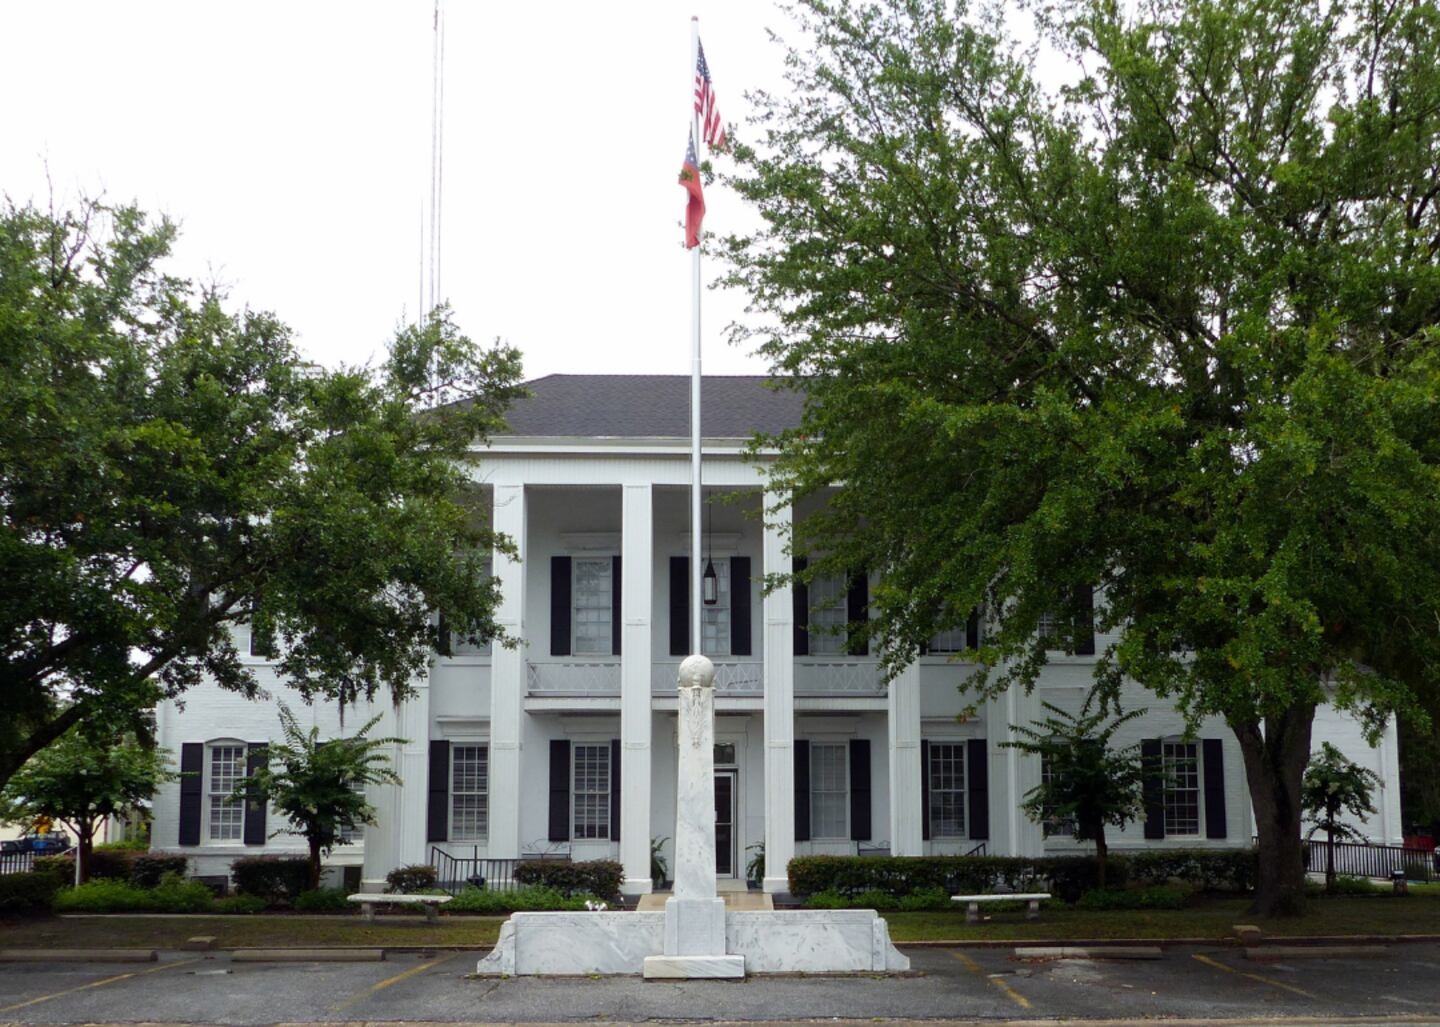
#43. Randolph County (tie)
- Life expectancy: 72.3 years
--- 3.8 years lower than the state average

Harris Aerial Solutions // Shutterstock
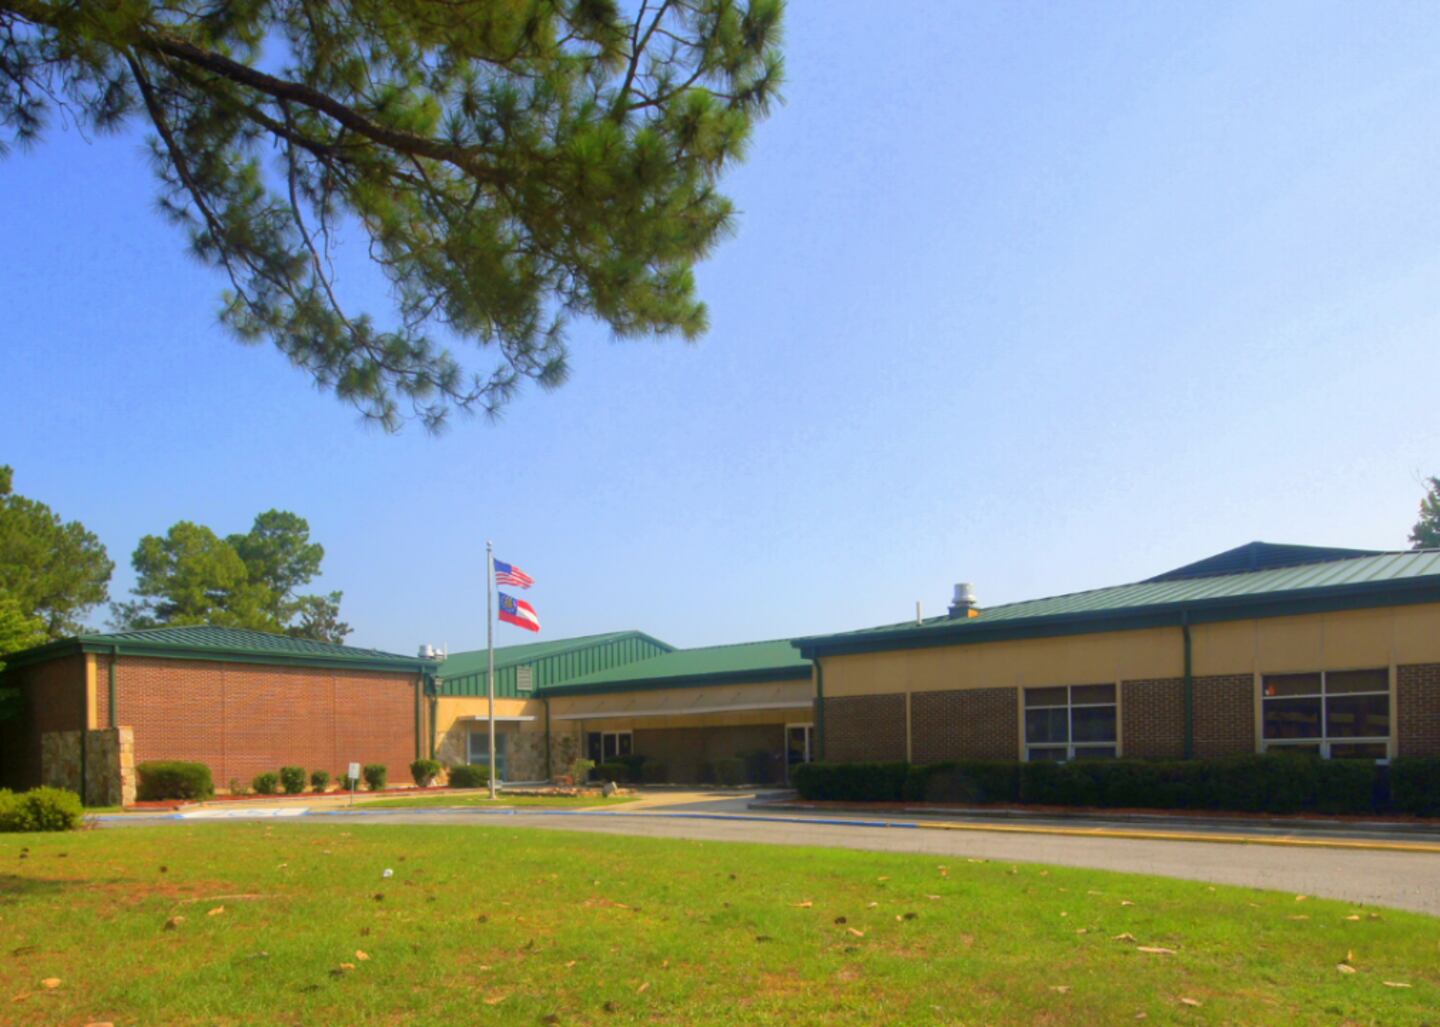
#43. Haralson County (tie)
- Life expectancy: 72.3 years
--- 3.8 years lower than the state average
Will478 // Shutterstock
#43. Peach County (tie)
- Life expectancy: 72.3 years
--- 3.8 years lower than the state average
Canva
#43. Irwin County (tie)
- Life expectancy: 72.3 years
--- 3.8 years lower than the state average
Georges_Creations // Shutterstock
#43. Spalding County (tie)
- Life expectancy: 72.3 years
--- 3.8 years lower than the state average
Michael Scott Milner // Shutterstock
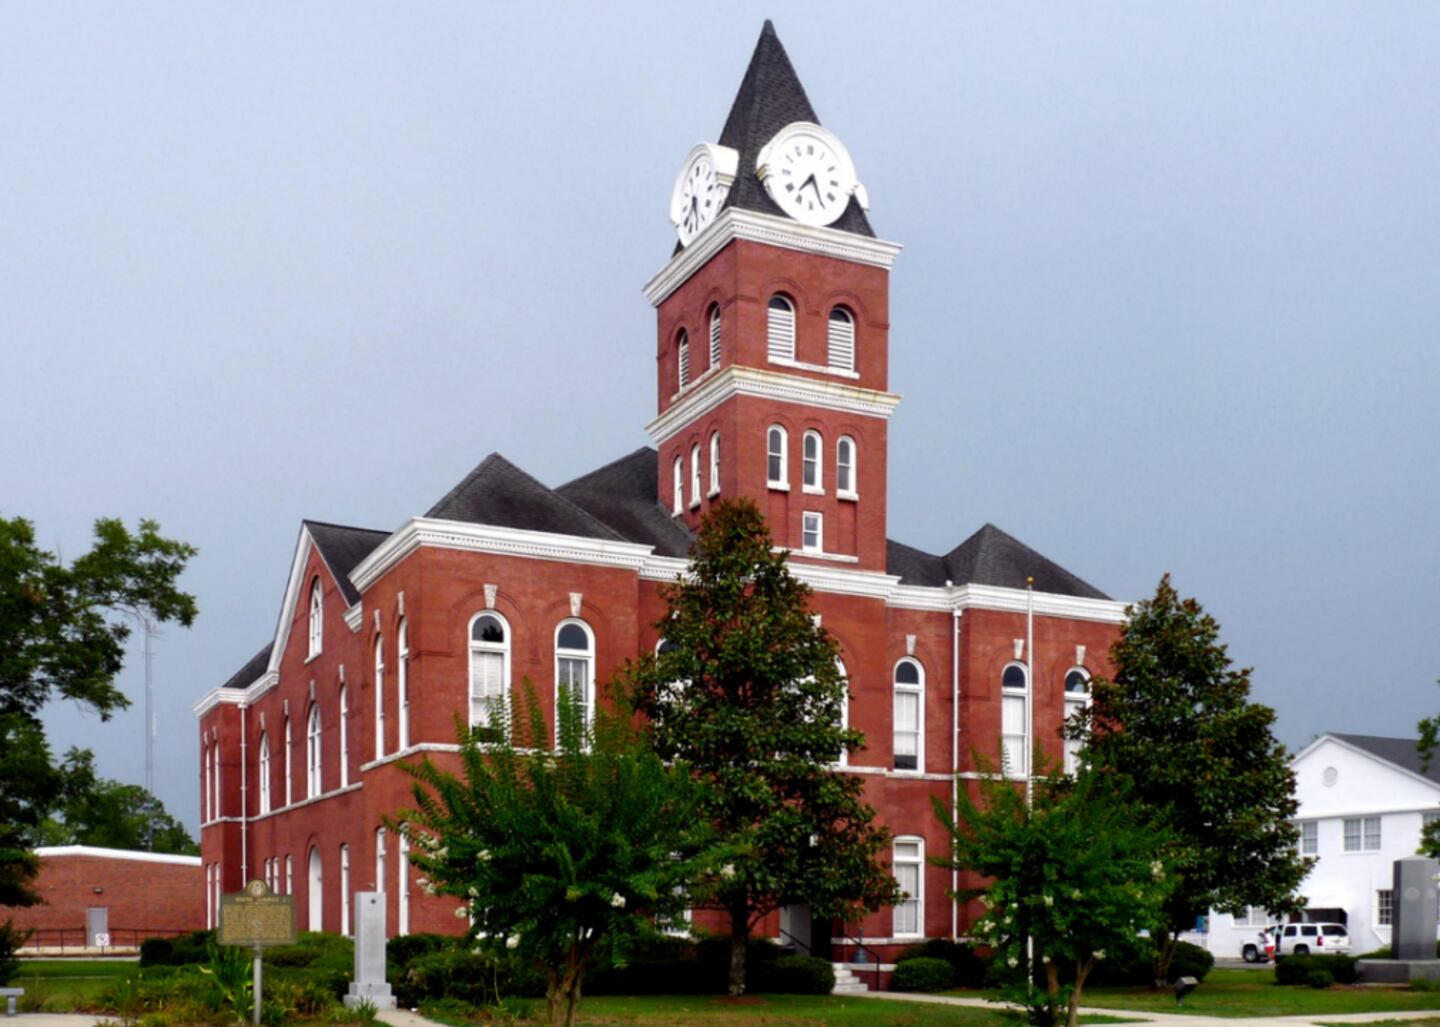
#42. Appling County
- Life expectancy: 72.2 years
--- 3.9 years lower than the state average

Canva
#39. Crawford County (tie)
- Life expectancy: 72.1 years
--- 4.0 years lower than the state average

Kevin Ruck // Shutterstock
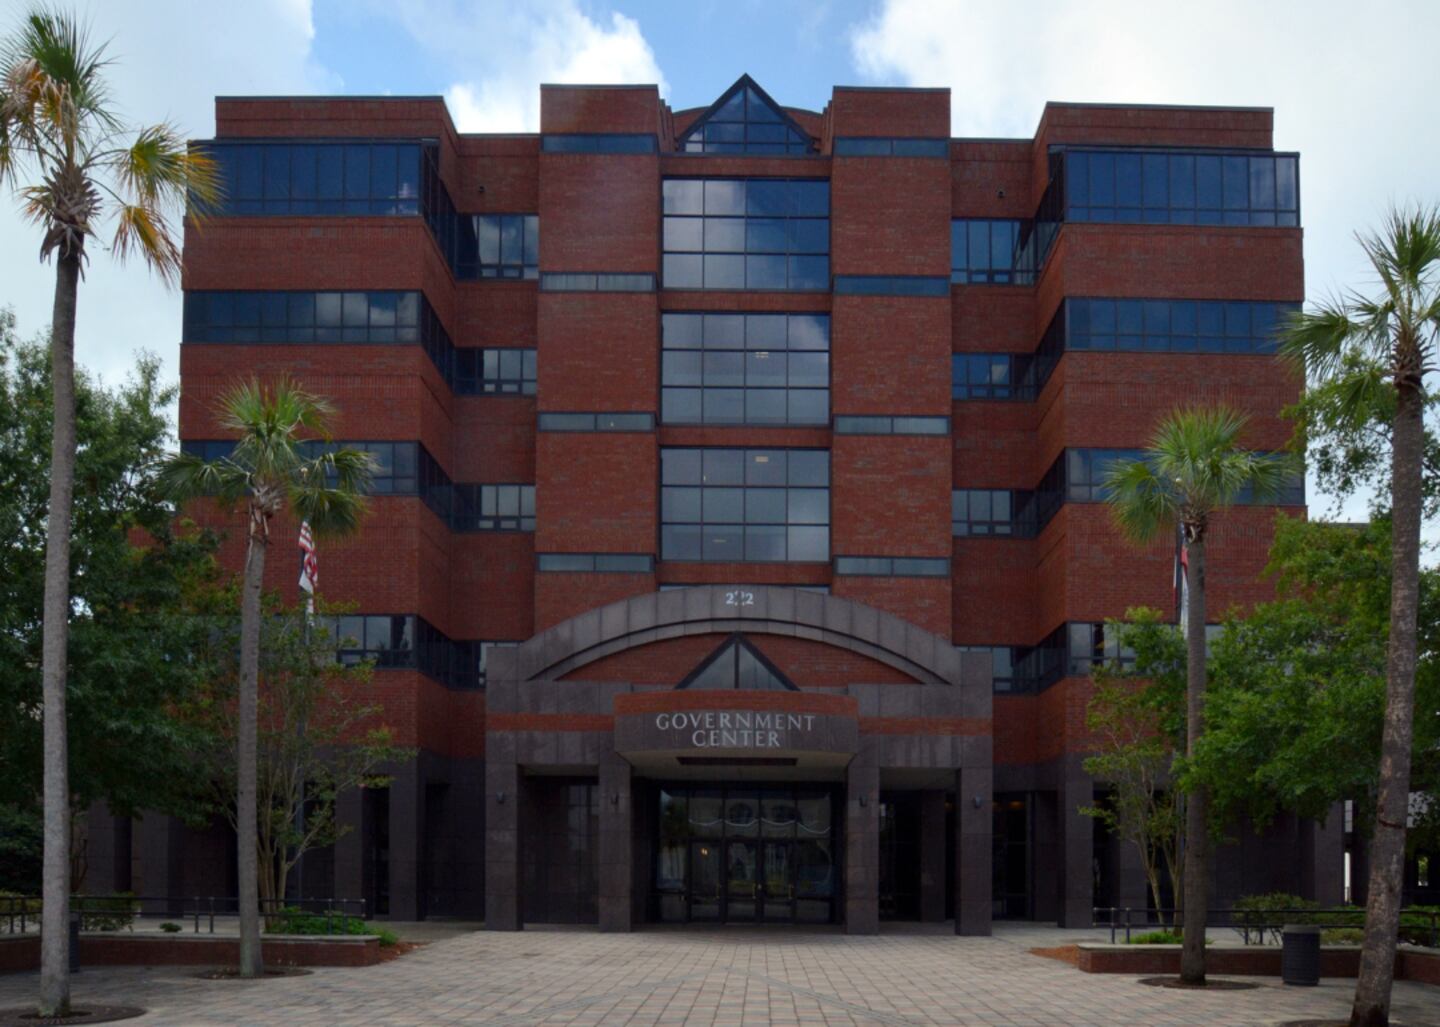
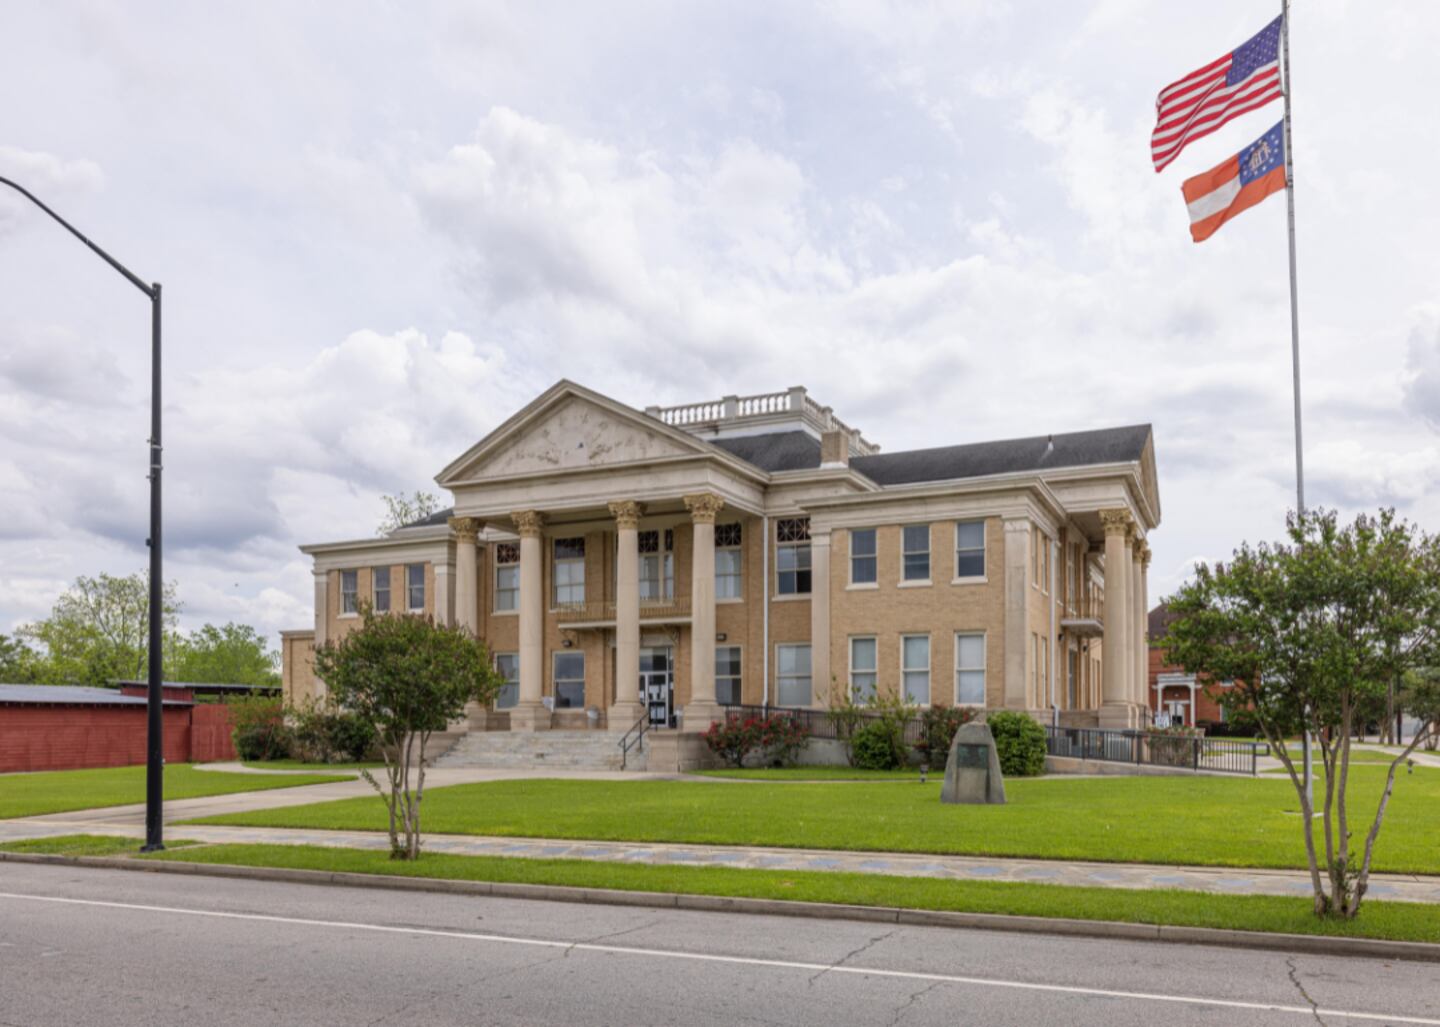
#39. Richmond County (tie)
- Life expectancy: 72.1 years
--- 4.0 years lower than the state average
Roberto Galan // Shutterstock
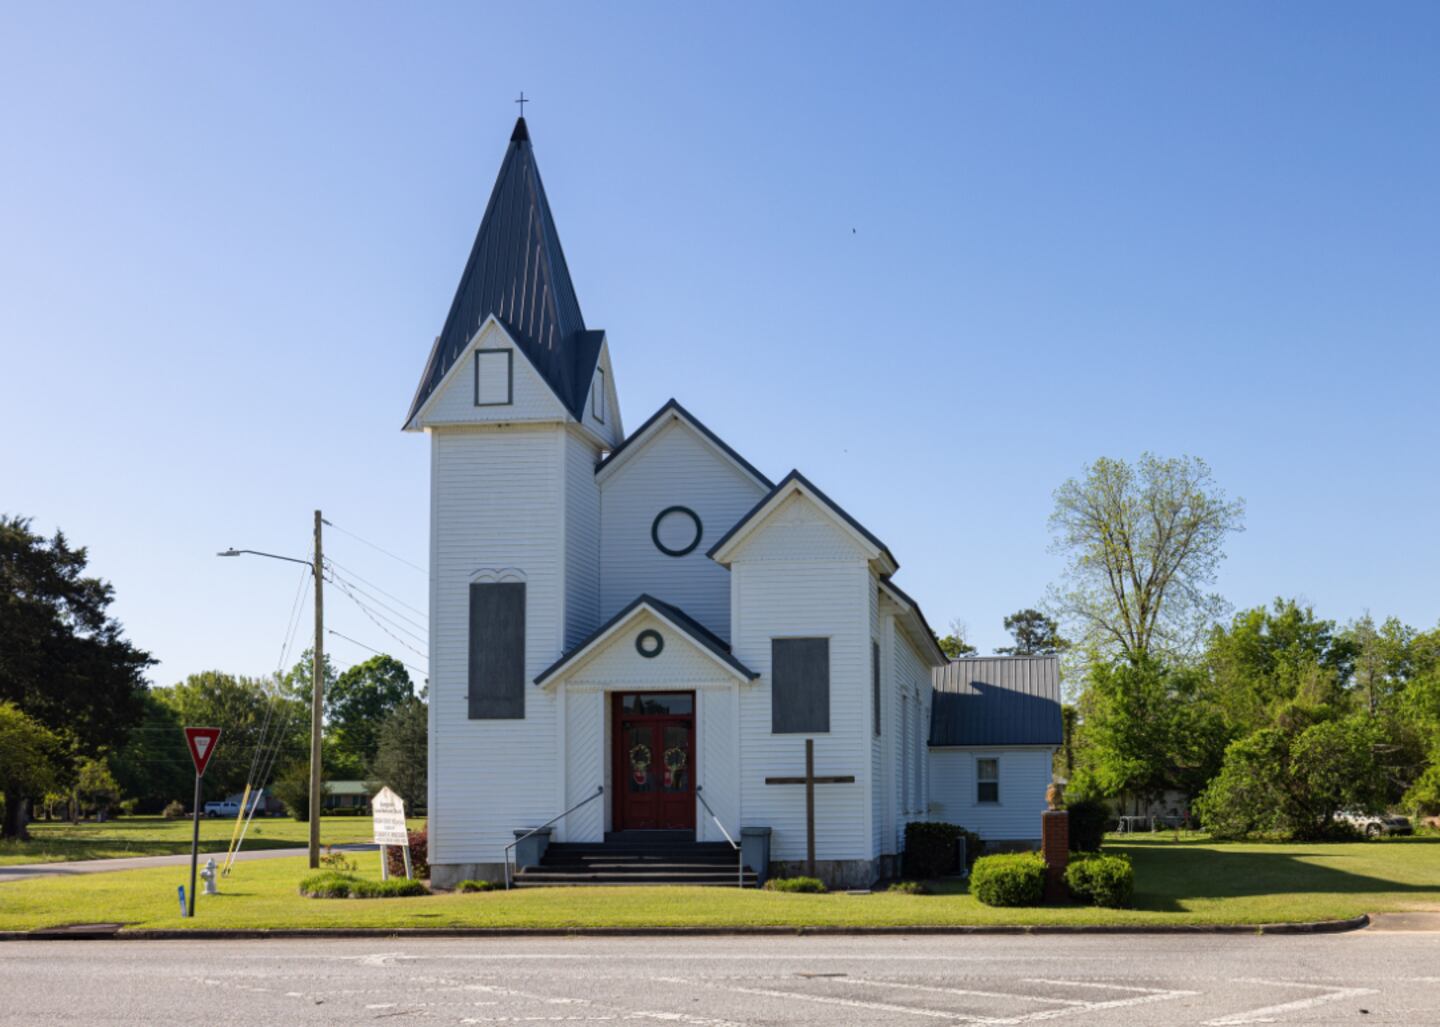
#39. Brantley County (tie)
- Life expectancy: 72.1 years
--- 4.0 years lower than the state average

SevenMaps // Shutterstock
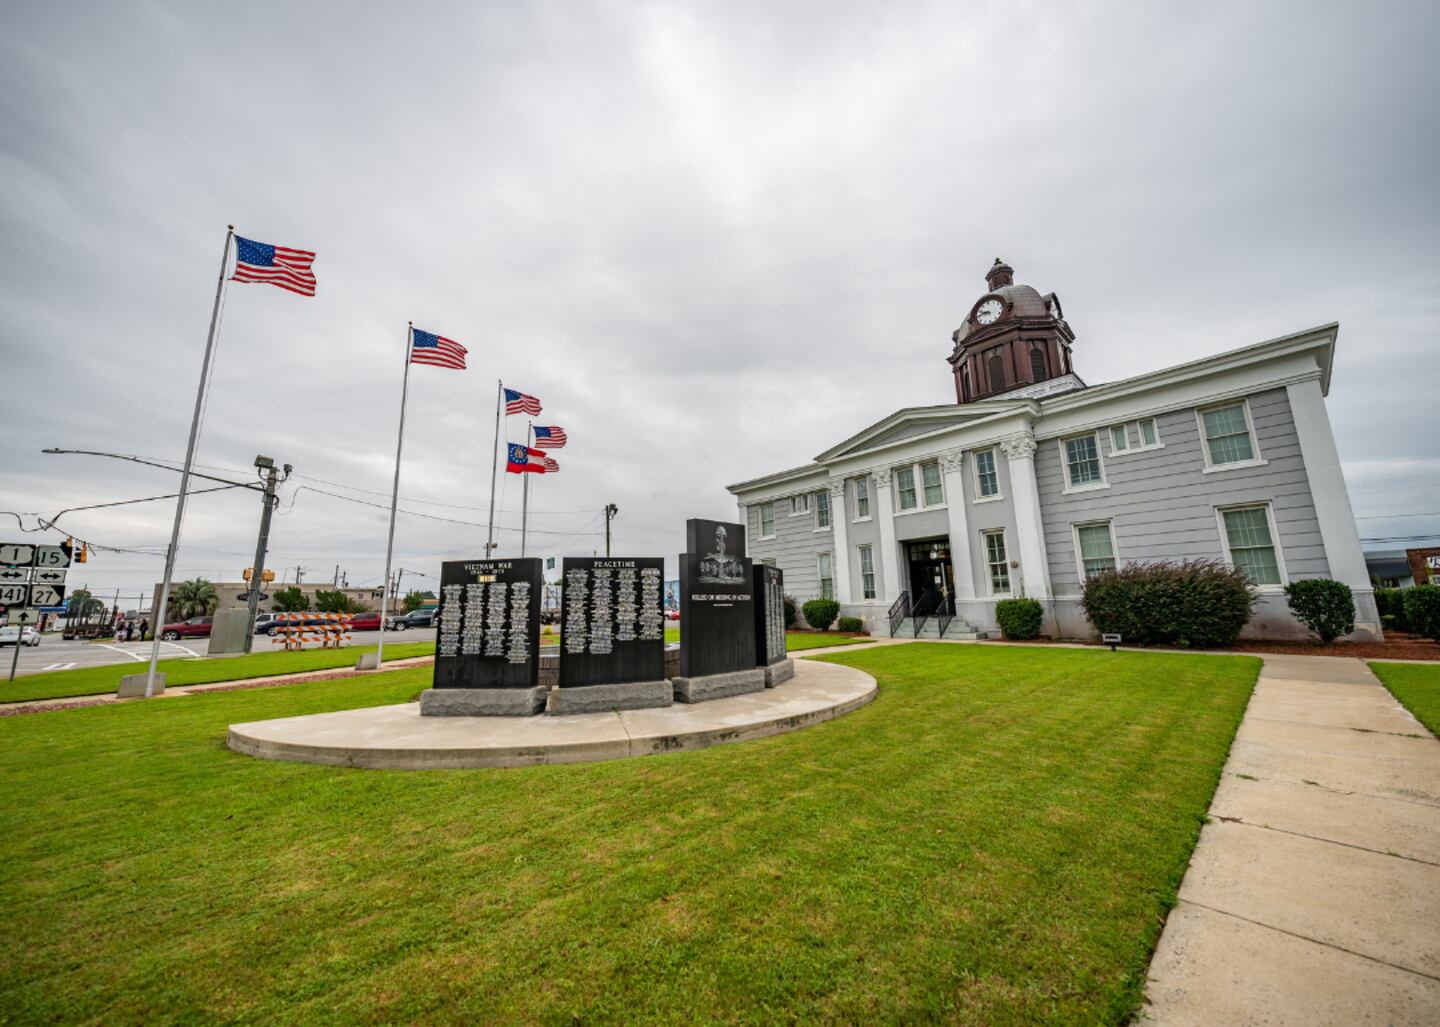
#35. Jeff Davis County (tie)
- Life expectancy: 72.0 years
--- 4.1 years lower than the state average

Canva
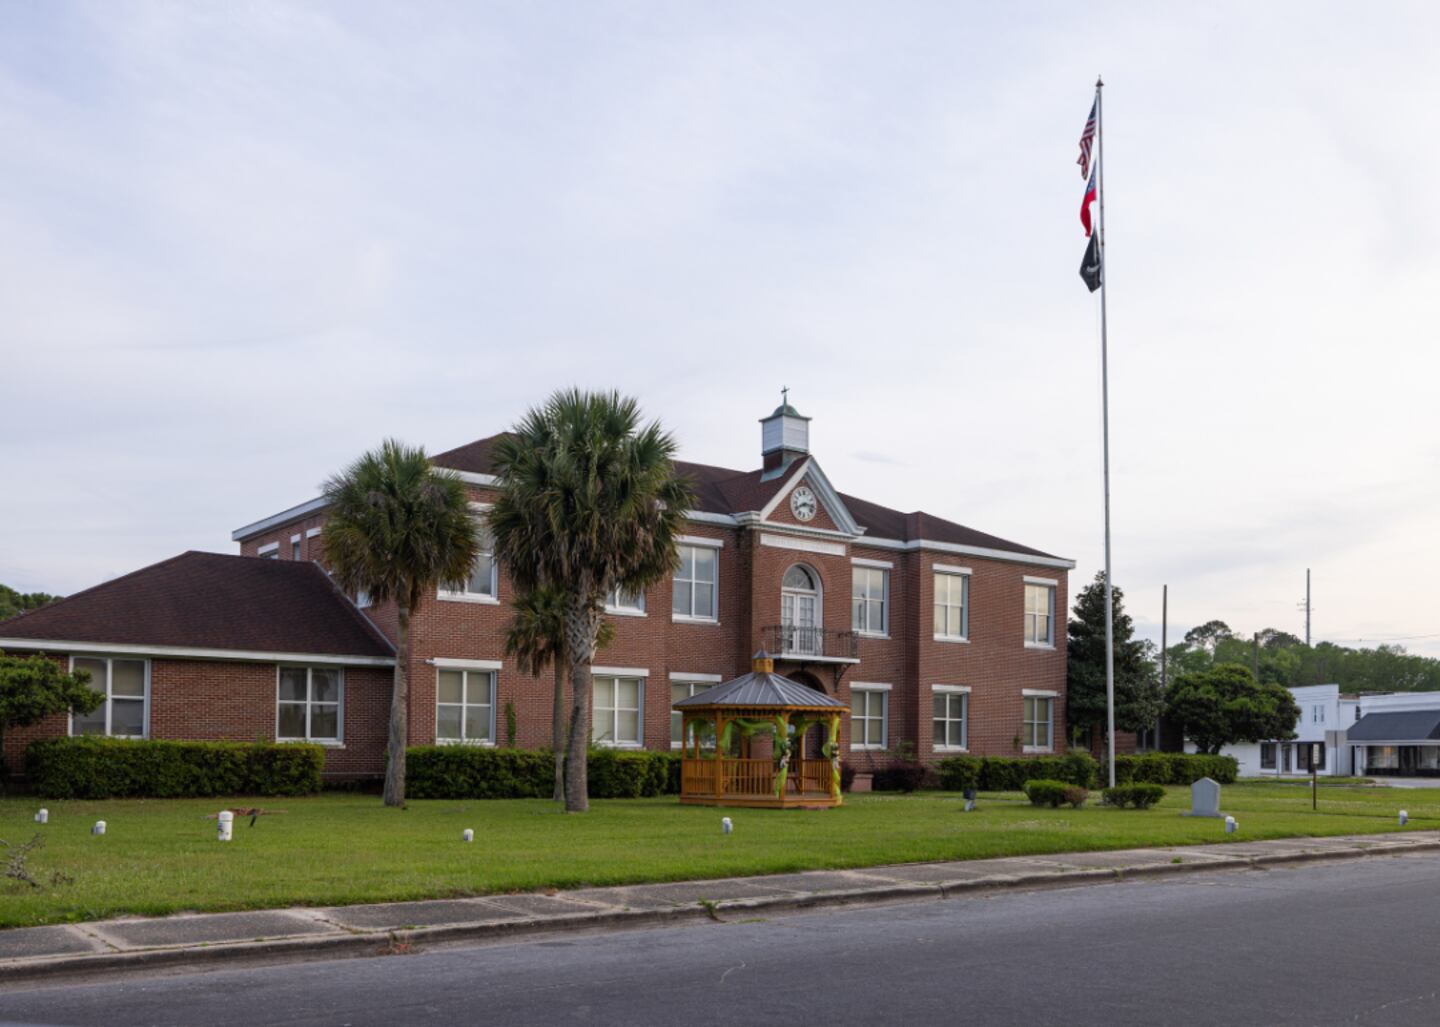
#35. Dodge County (tie)
- Life expectancy: 72.0 years
--- 4.1 years lower than the state average
Canva
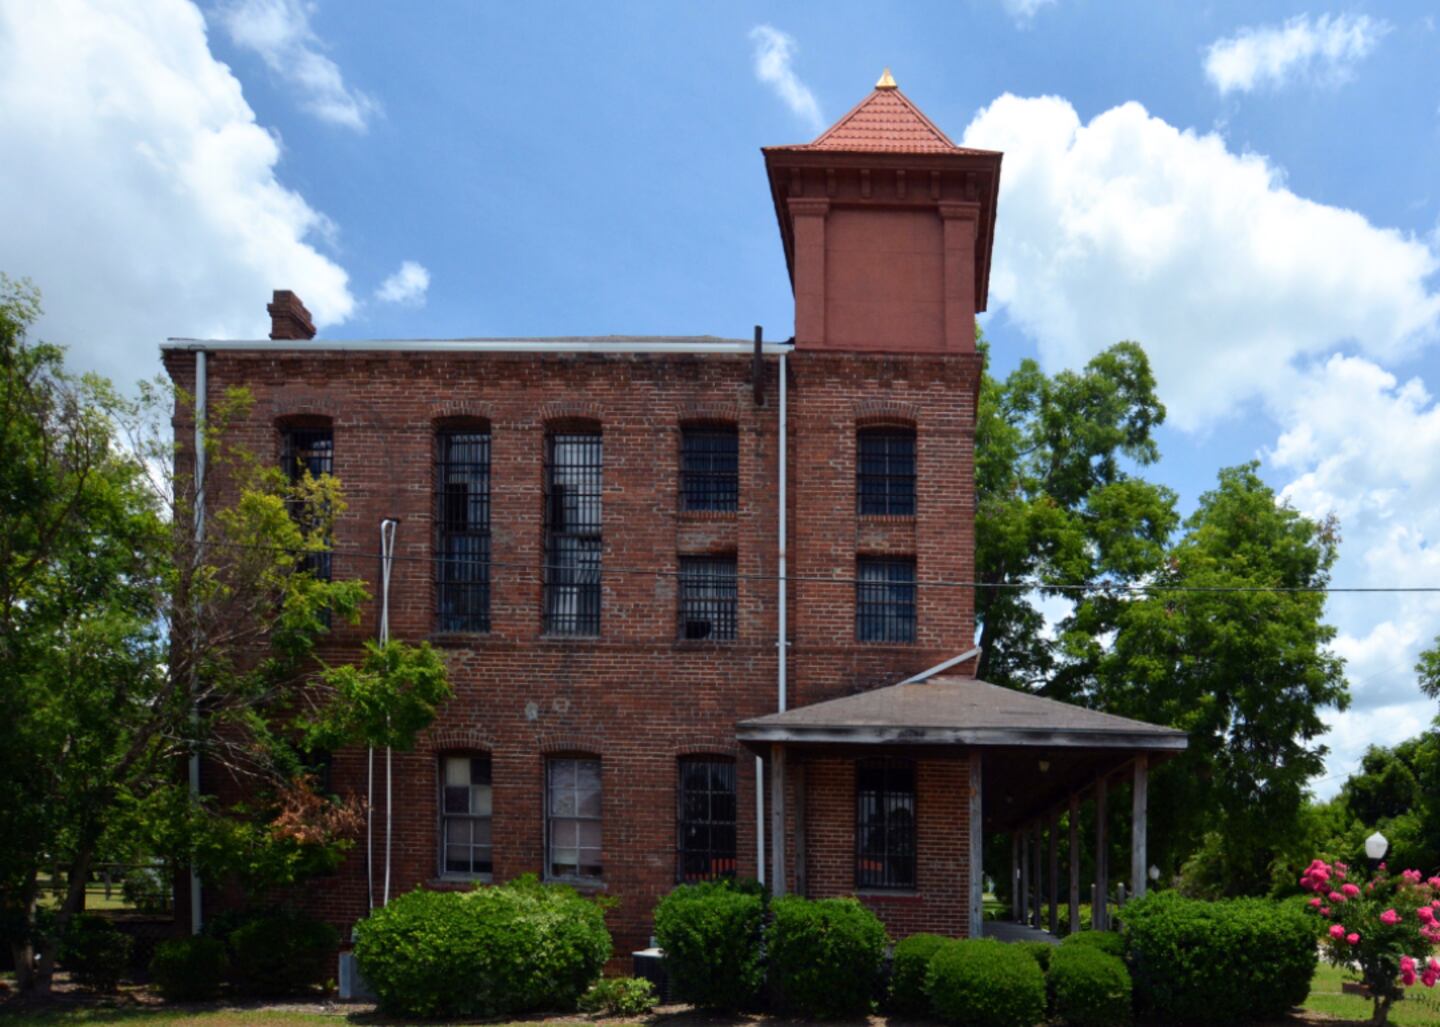
#35. Berrien County (tie)
- Life expectancy: 72.0 years
--- 4.1 years lower than the state average

Roberto Galan // Shutterstock
#35. Turner County (tie)
- Life expectancy: 72.0 years
--- 4.1 years lower than the state average
Canva
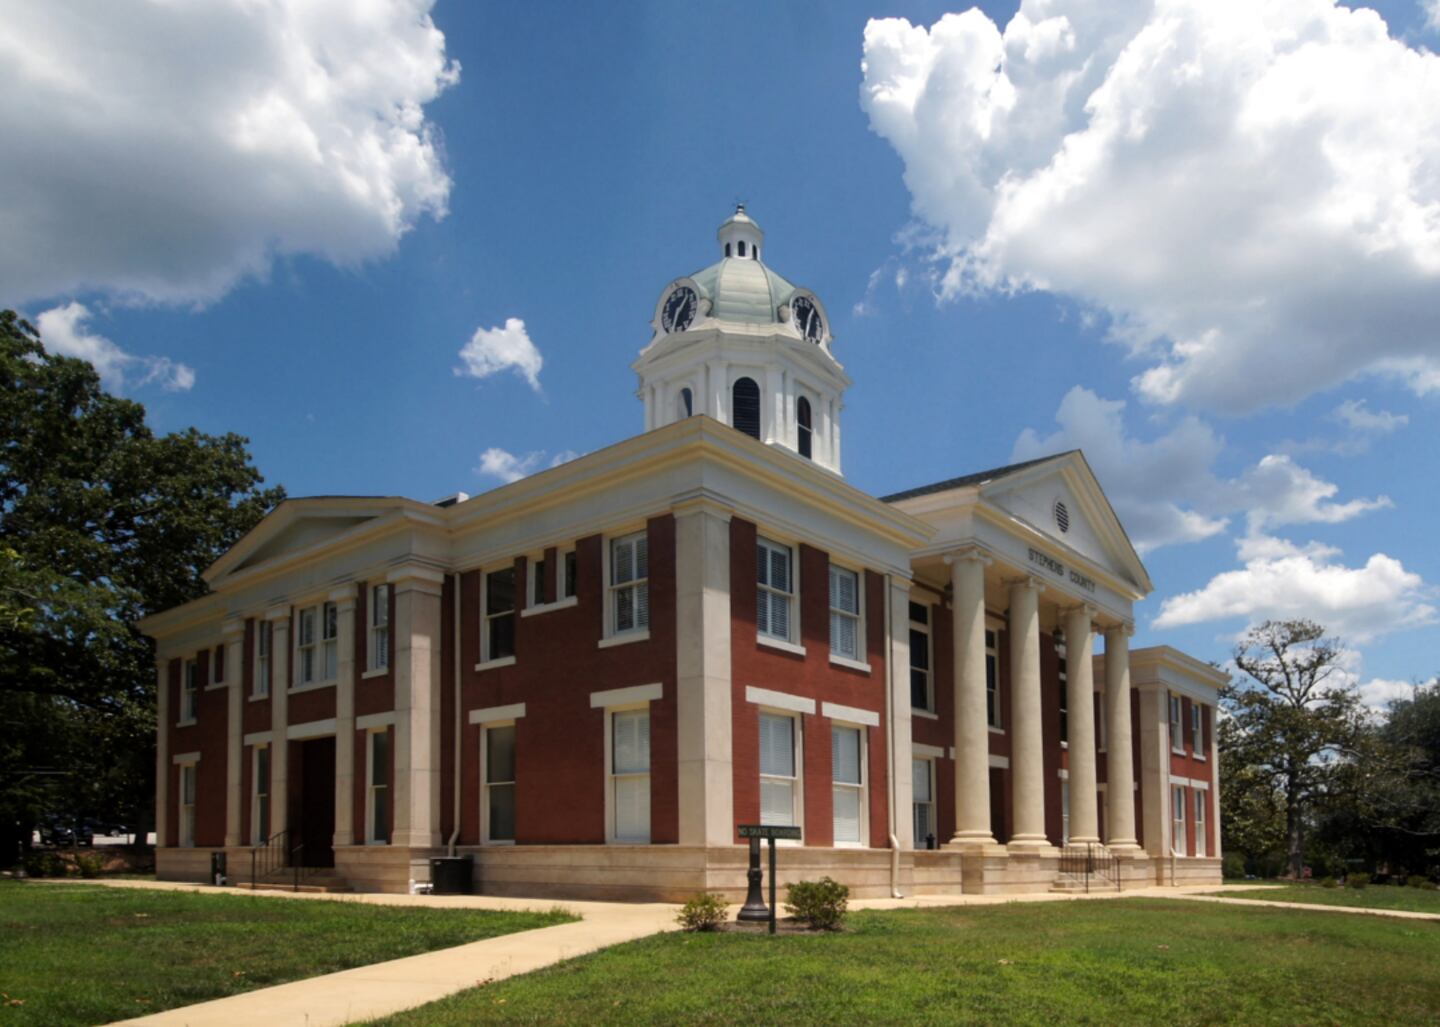
#32. Stephens County (tie)
- Life expectancy: 71.9 years
--- 4.2 years lower than the state average
Canva
#32. Decatur County (tie)
- Life expectancy: 71.9 years
--- 4.2 years lower than the state average
Canva
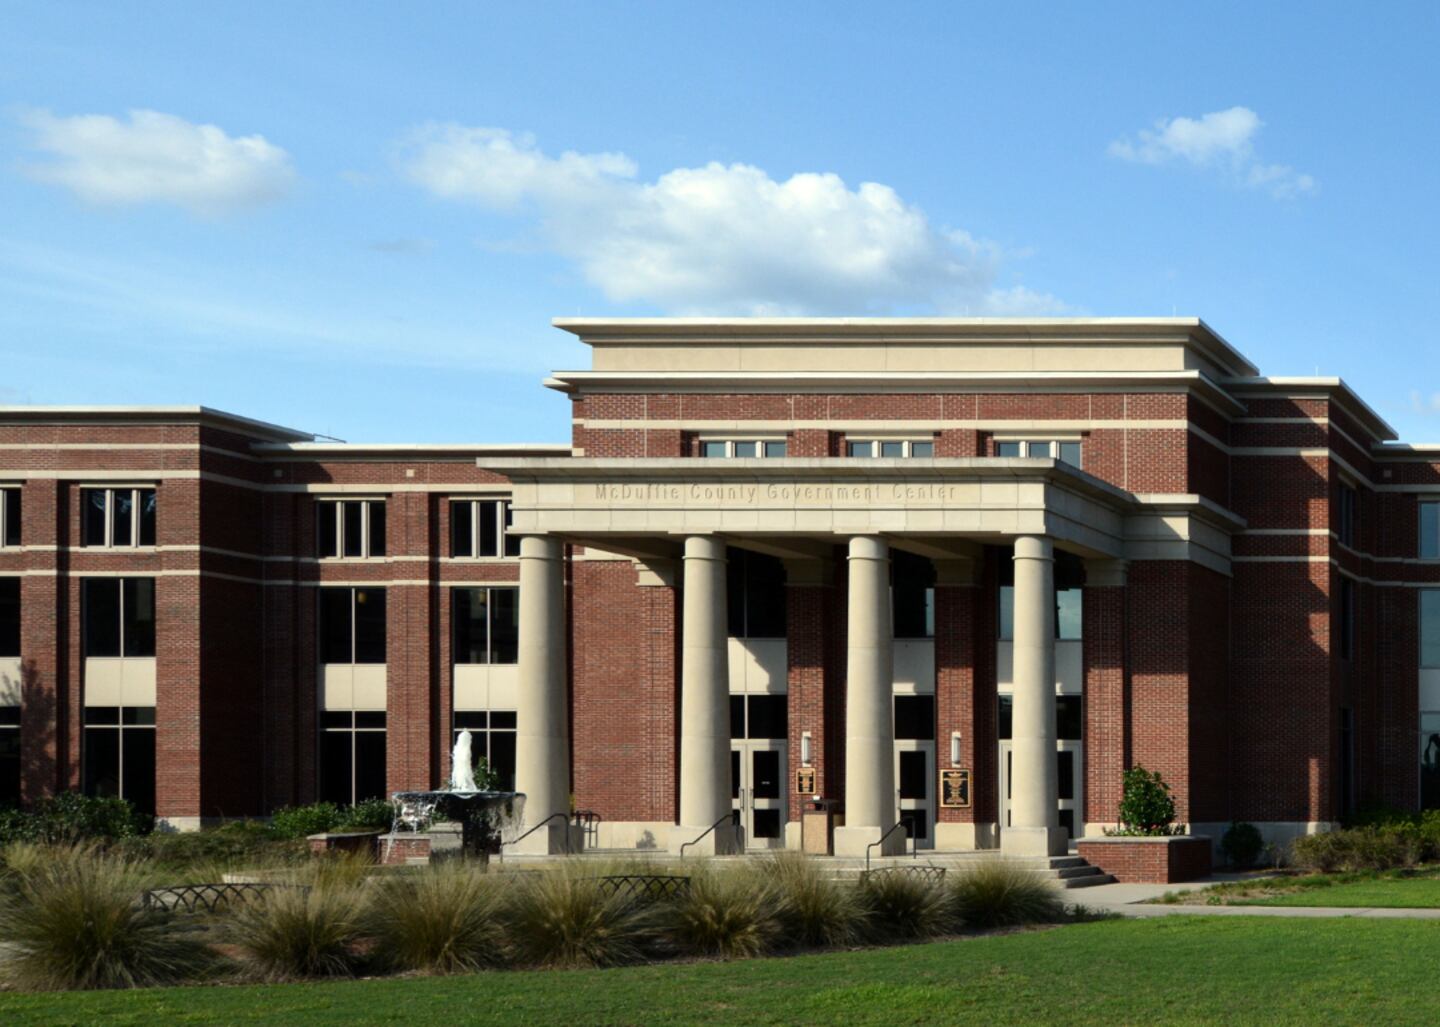
#32. McDuffie County (tie)
- Life expectancy: 71.9 years
--- 4.2 years lower than the state average
Roberto Galan // Shutterstock
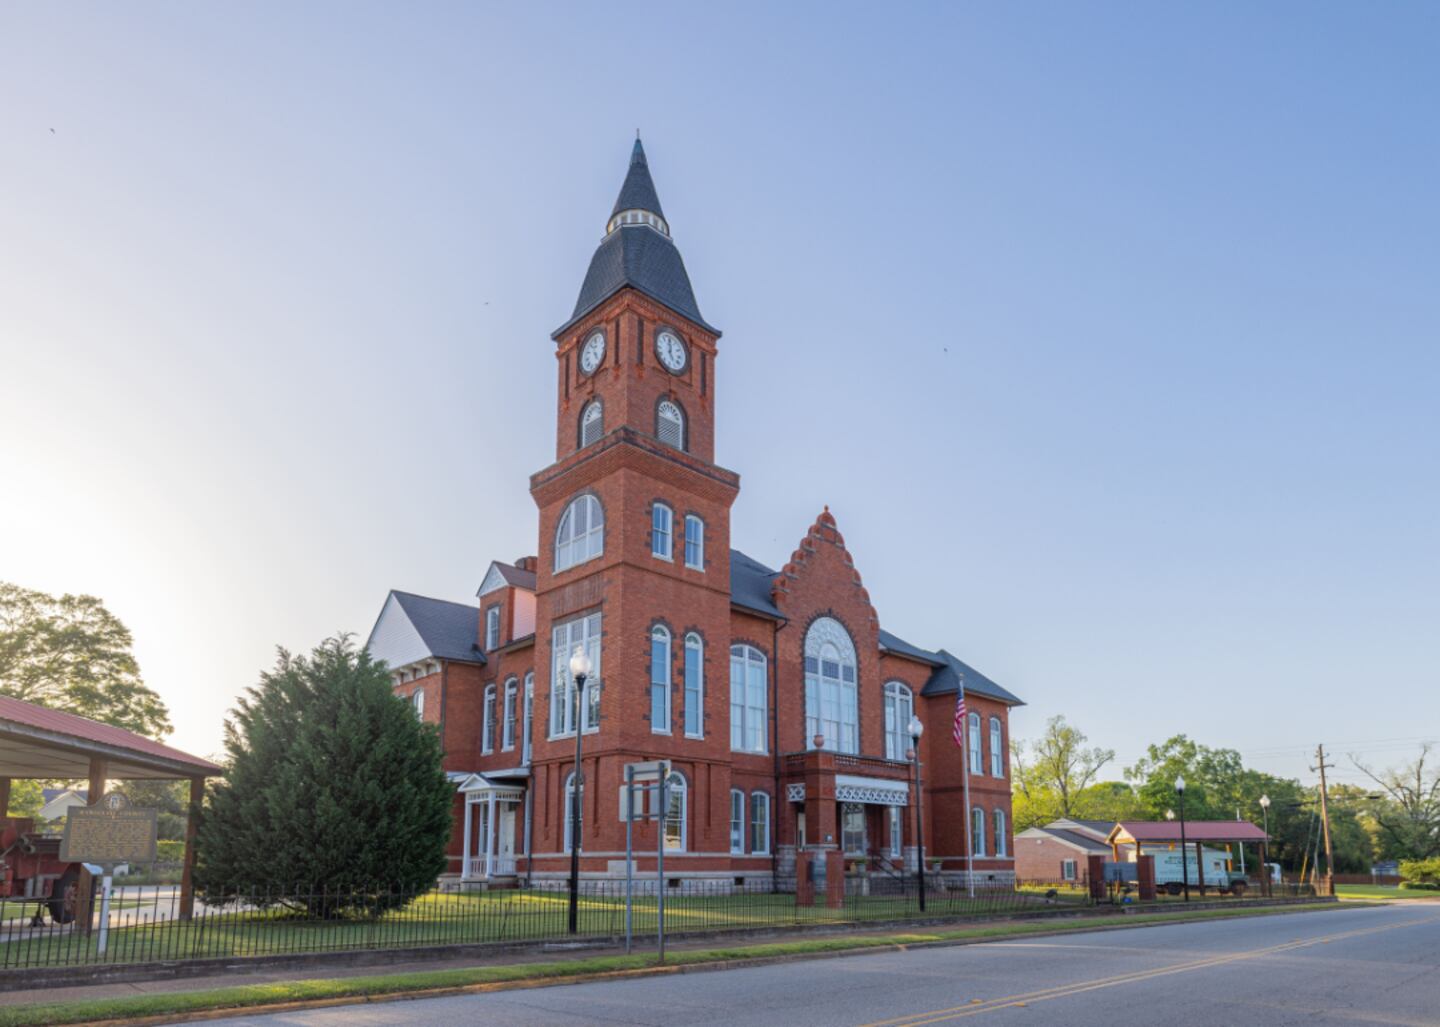
#29. Terrell County (tie)
- Life expectancy: 71.8 years
--- 4.3 years lower than the state average
Thomas Barrat // Shutterstock
#29. Chattooga County (tie)
- Life expectancy: 71.8 years
--- 4.3 years lower than the state average
Canva
#29. Screven County (tie)
- Life expectancy: 71.8 years
--- 4.3 years lower than the state average
Canva
#28. Wayne County
- Life expectancy: 71.7 years
--- 4.4 years lower than the state average

Canva
#25. Bibb County (tie)
- Life expectancy: 71.4 years
--- 4.7 years lower than the state average
Canva
#25. Dougherty County (tie)
- Life expectancy: 71.4 years
--- 4.7 years lower than the state average
SevenMaps // Shutterstock
#25. Evans County (tie)
- Life expectancy: 71.4 years
--- 4.7 years lower than the state average
Roberto Galan // Shutterstock
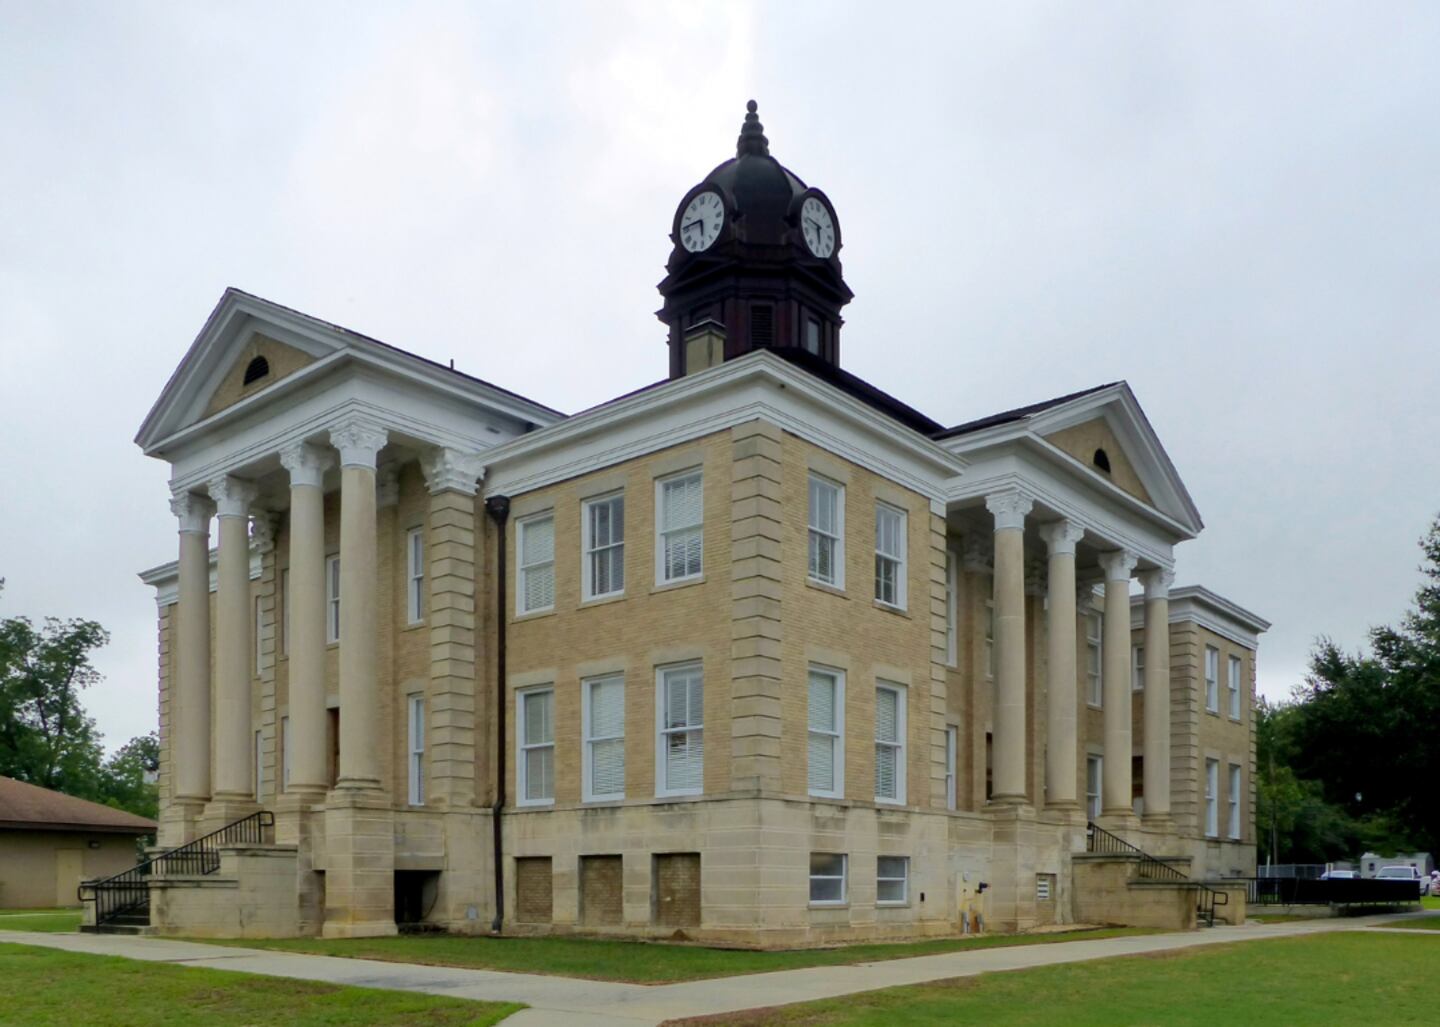
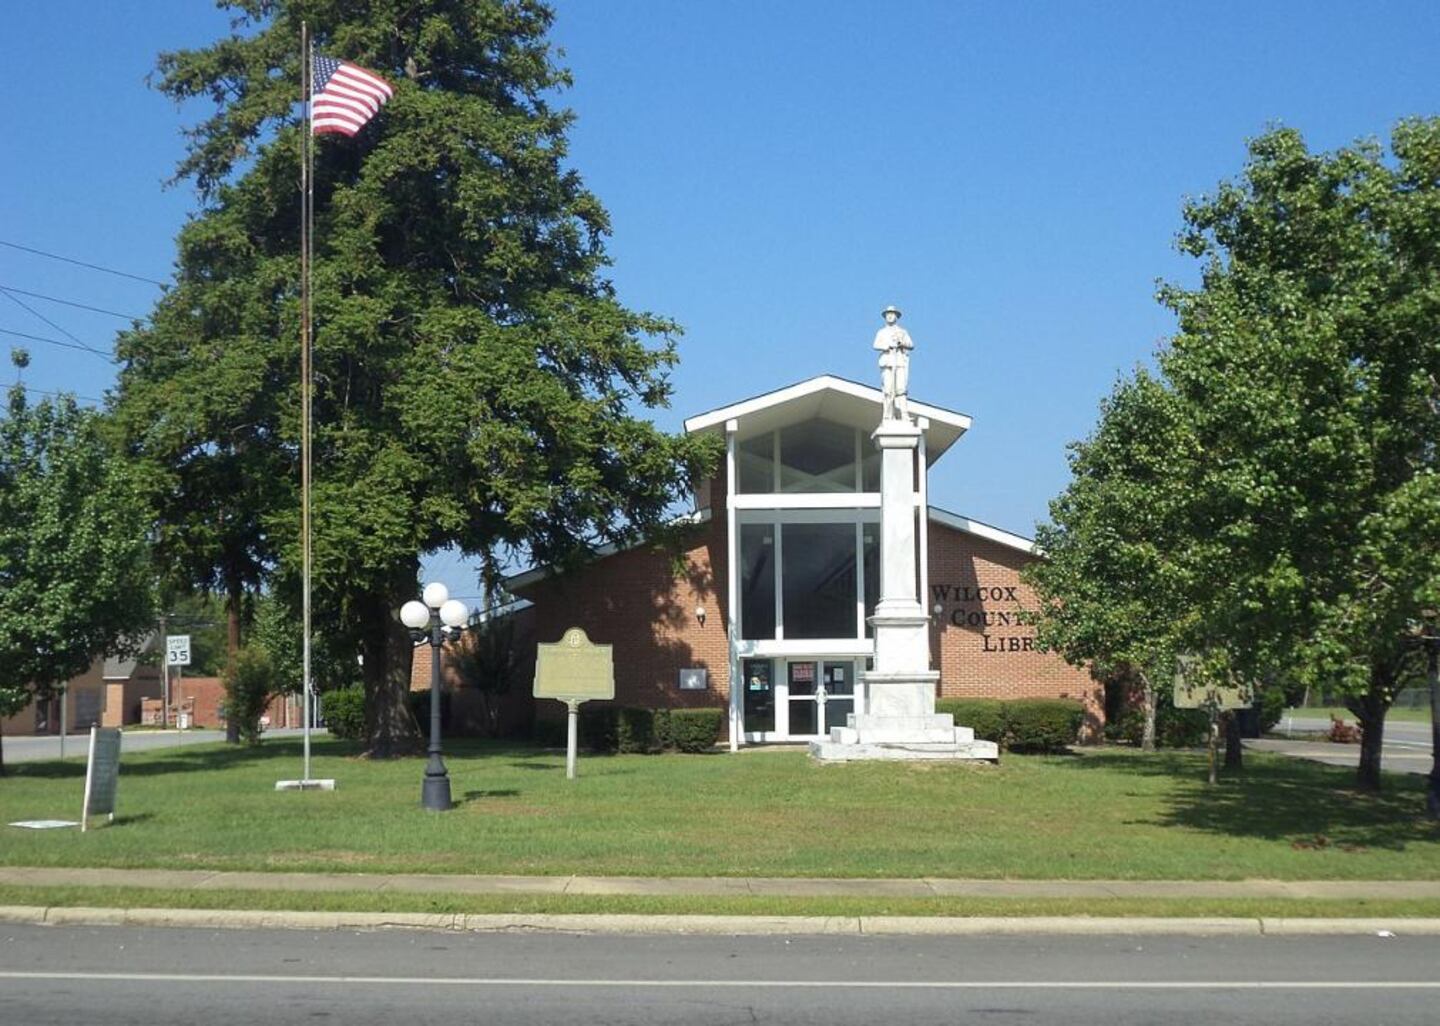
#22. Wilcox County (tie)
- Life expectancy: 71.3 years
--- 4.8 years lower than the state average

Canva
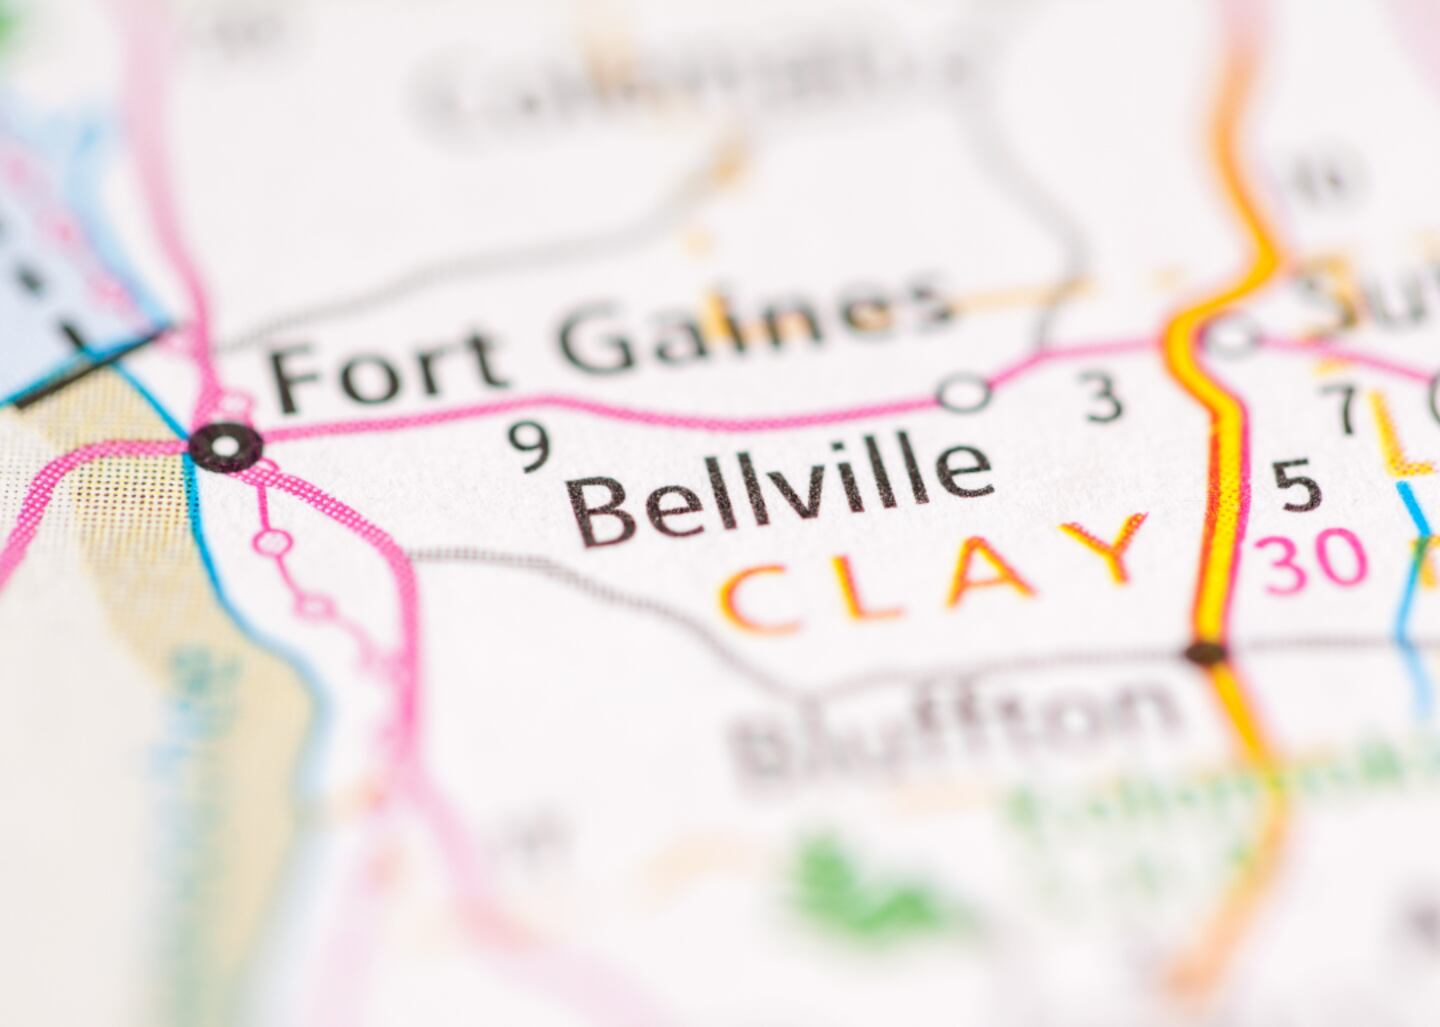
#22. Clay County (tie)
- Life expectancy: 71.3 years
--- 4.8 years lower than the state average

JNix // Shutterstock
#22. Polk County (tie)
- Life expectancy: 71.3 years
--- 4.8 years lower than the state average
Canva
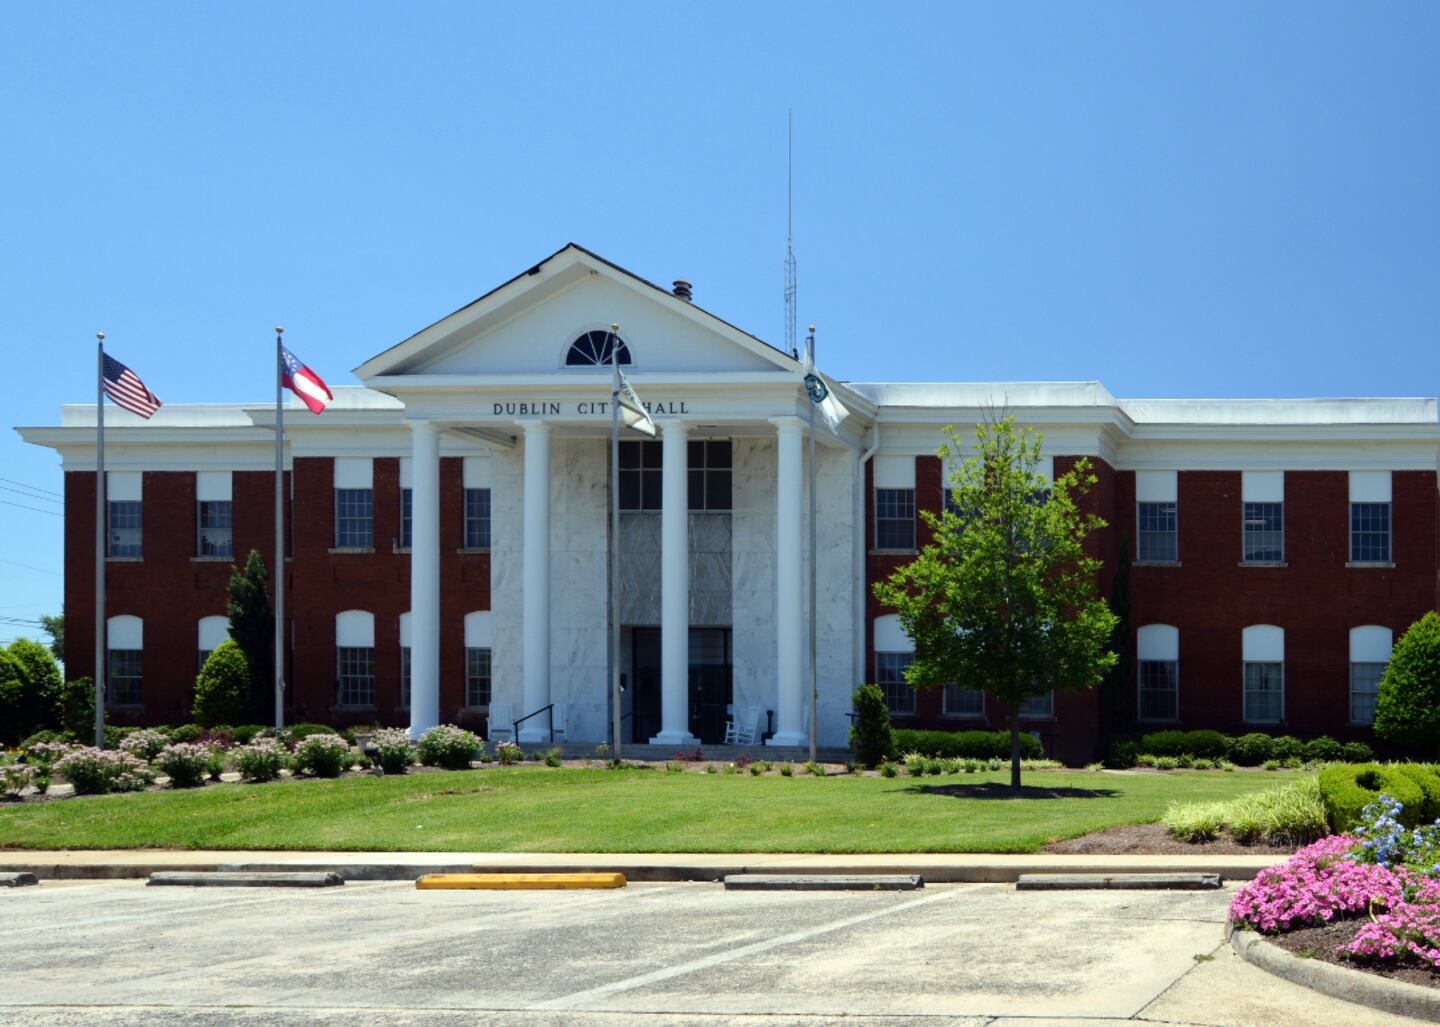
#19. Laurens County (tie)
- Life expectancy: 71.2 years
--- 4.9 years lower than the state average
Canva
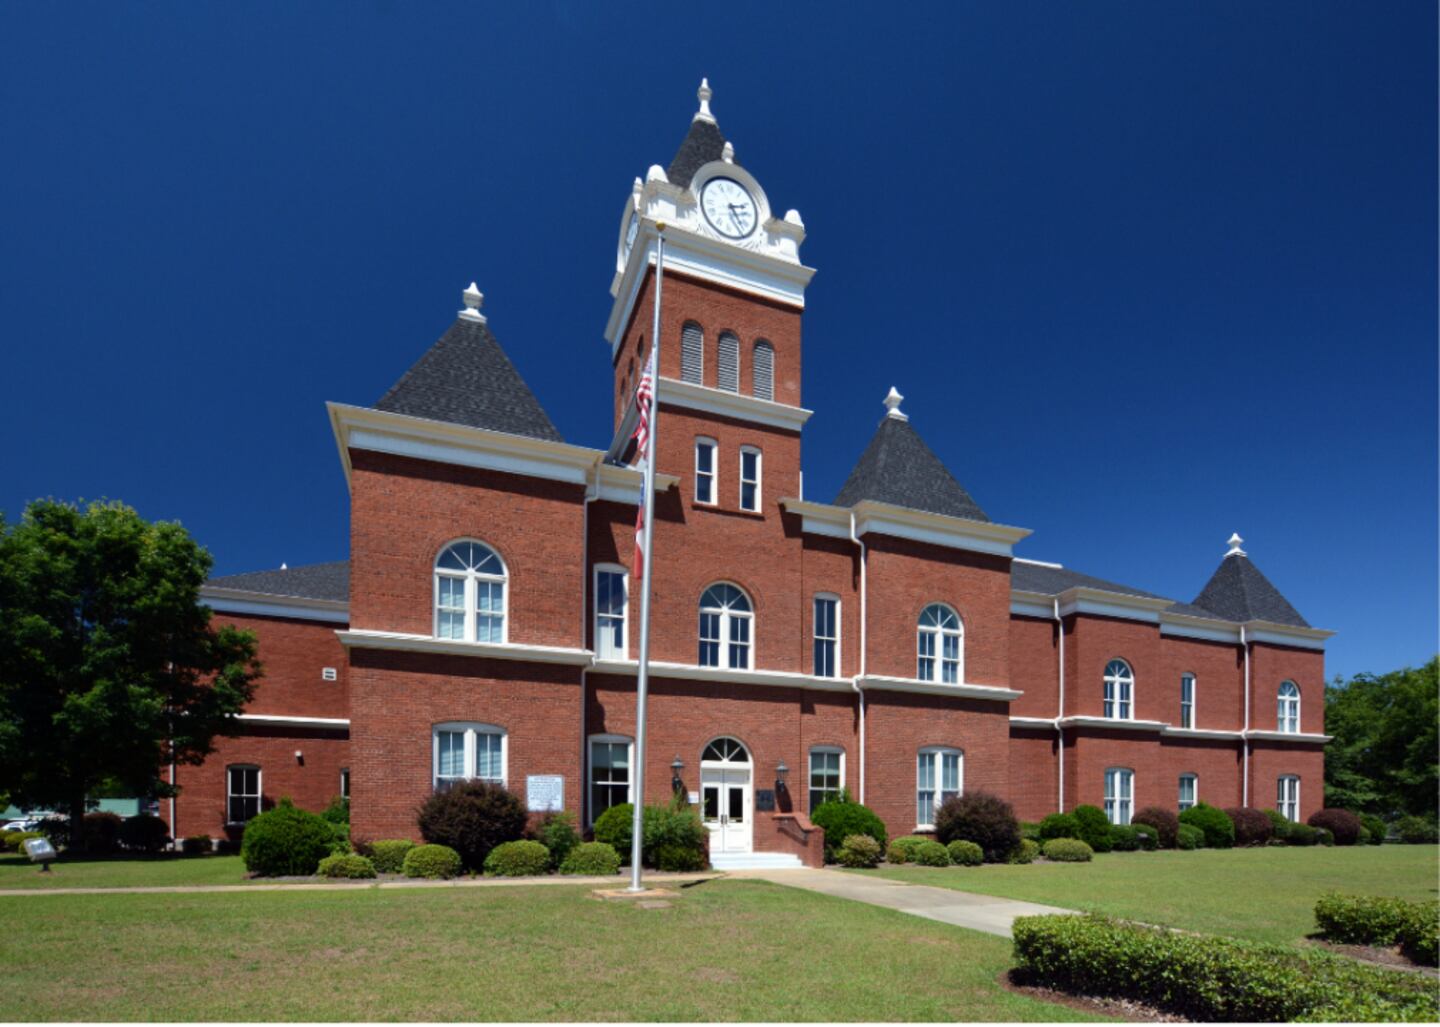
#19. Twiggs County (tie)
- Life expectancy: 71.2 years
--- 4.9 years lower than the state average

Dominique James // Shutterstock
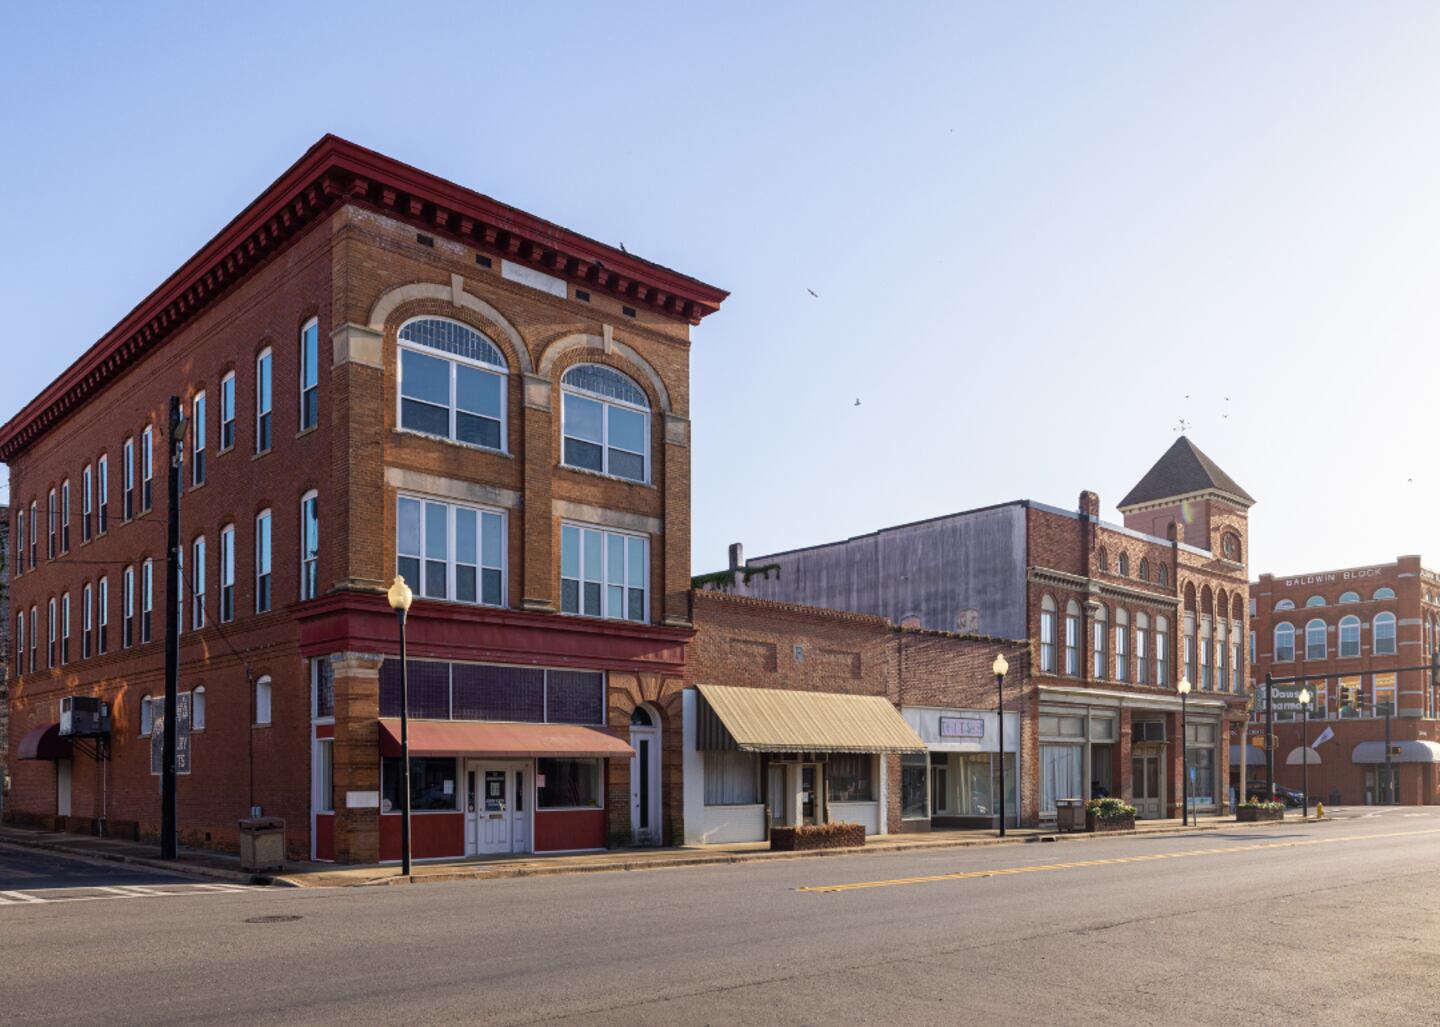
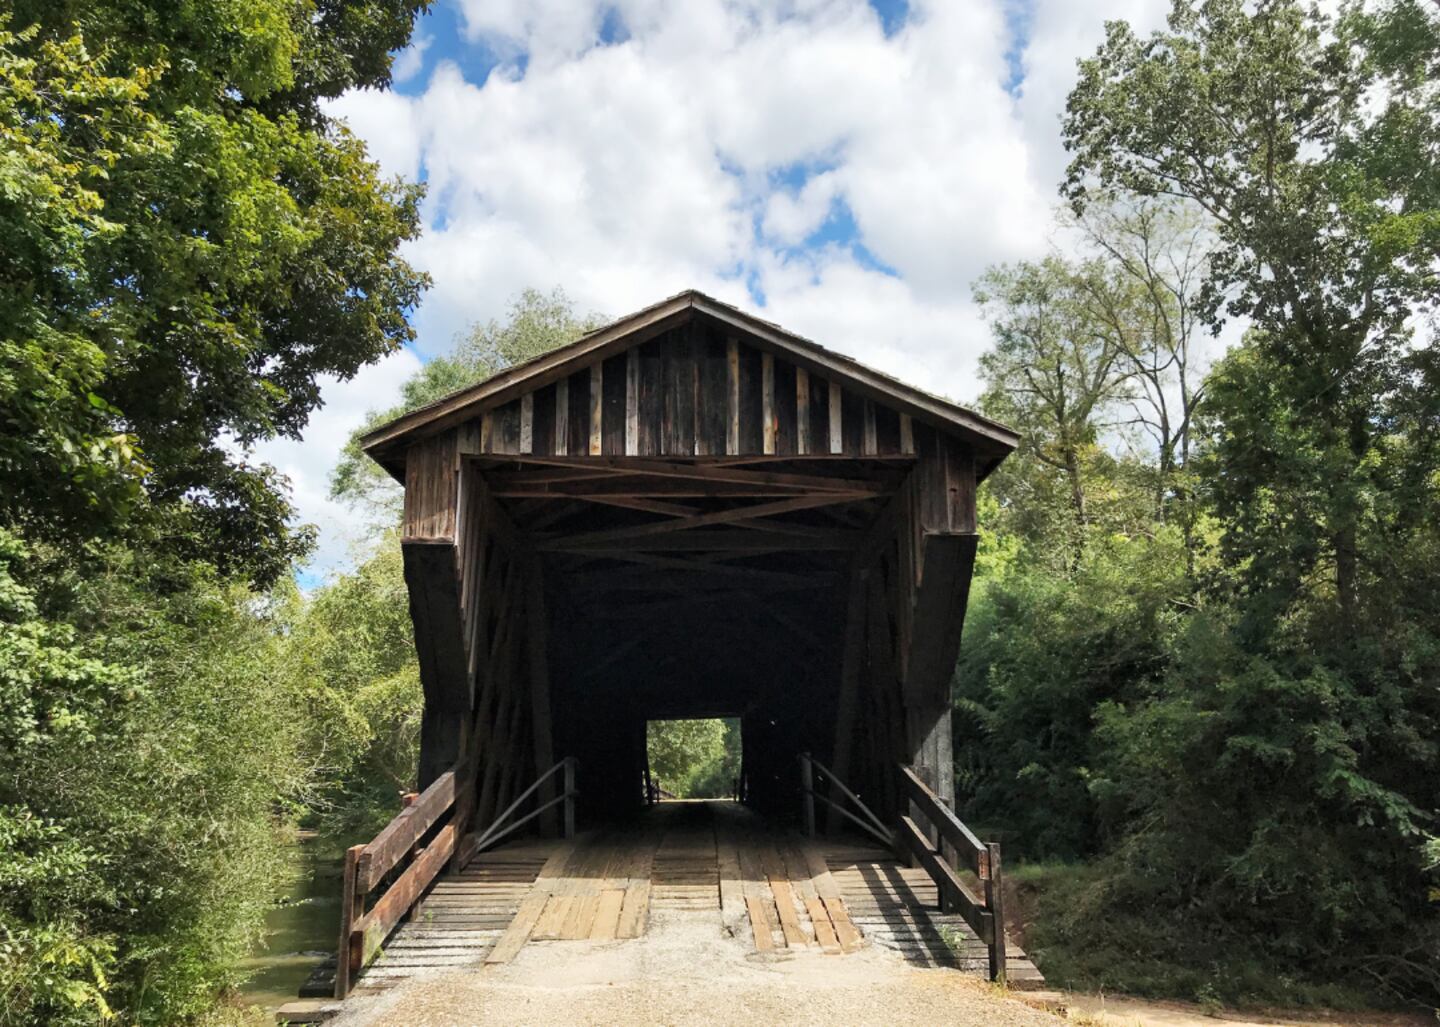
#19. Toombs County (tie)
- Life expectancy: 71.2 years
--- 4.9 years lower than the state average
Canva
#17. Meriwether County (tie)
- Life expectancy: 71.1 years
--- 5.0 years lower than the state average

Canva
#17. Hancock County (tie)
- Life expectancy: 71.1 years
--- 5.0 years lower than the state average
Canva
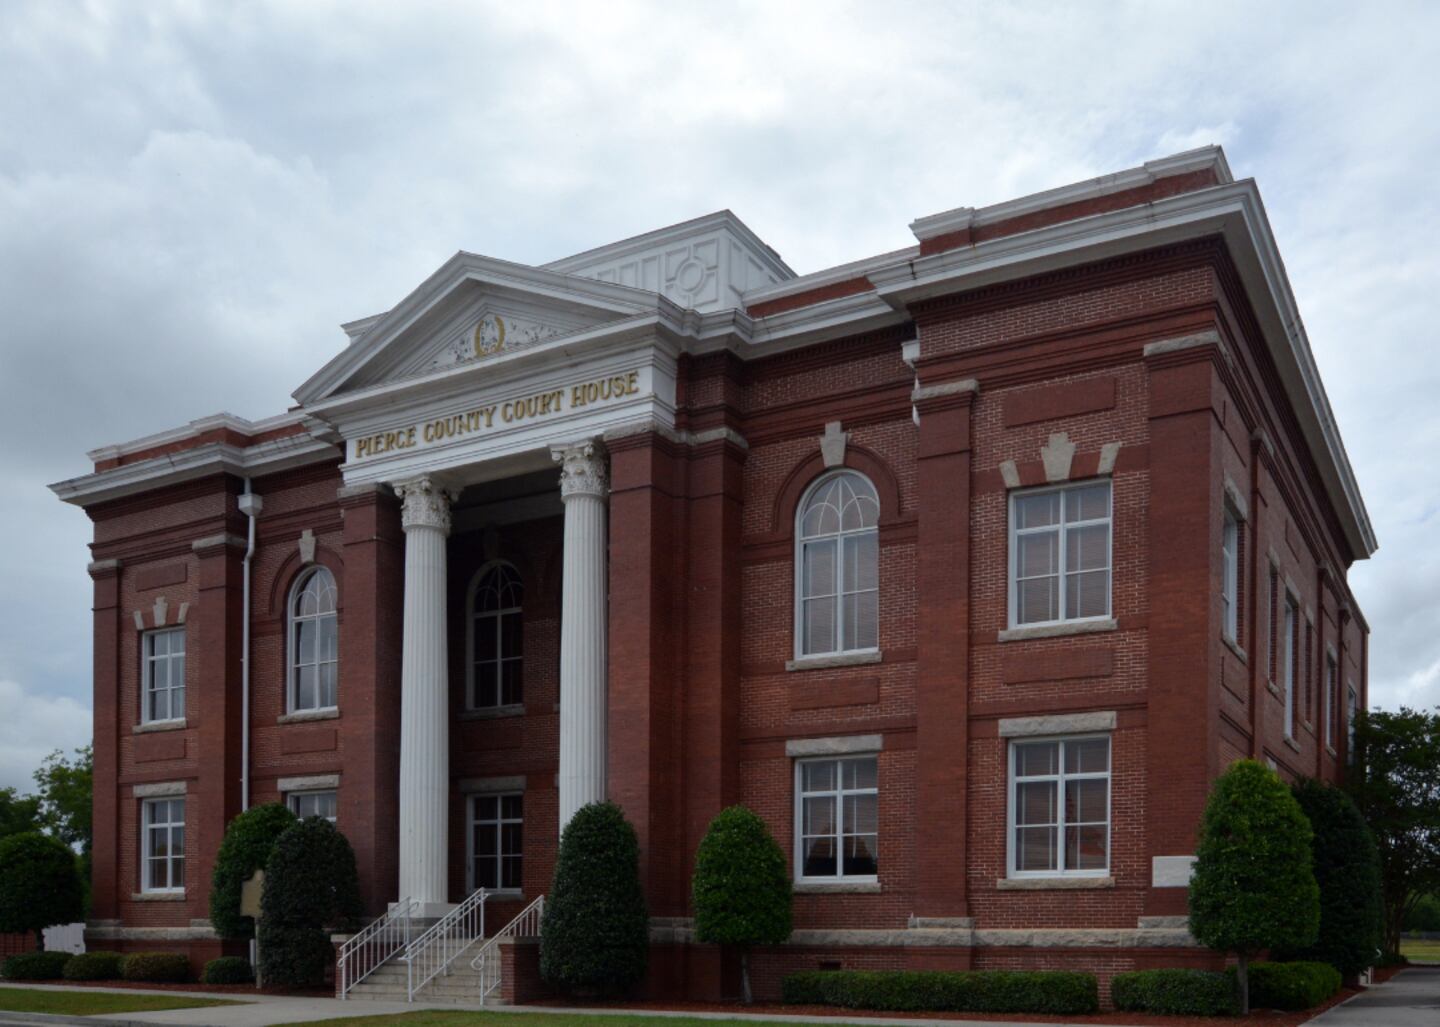
#15. Pierce County (tie)
- Life expectancy: 71.0 years
--- 5.1 years lower than the state average

SevenMaps // Shutterstock
#15. Treutlen County (tie)
- Life expectancy: 71.0 years
--- 5.1 years lower than the state average
Canva
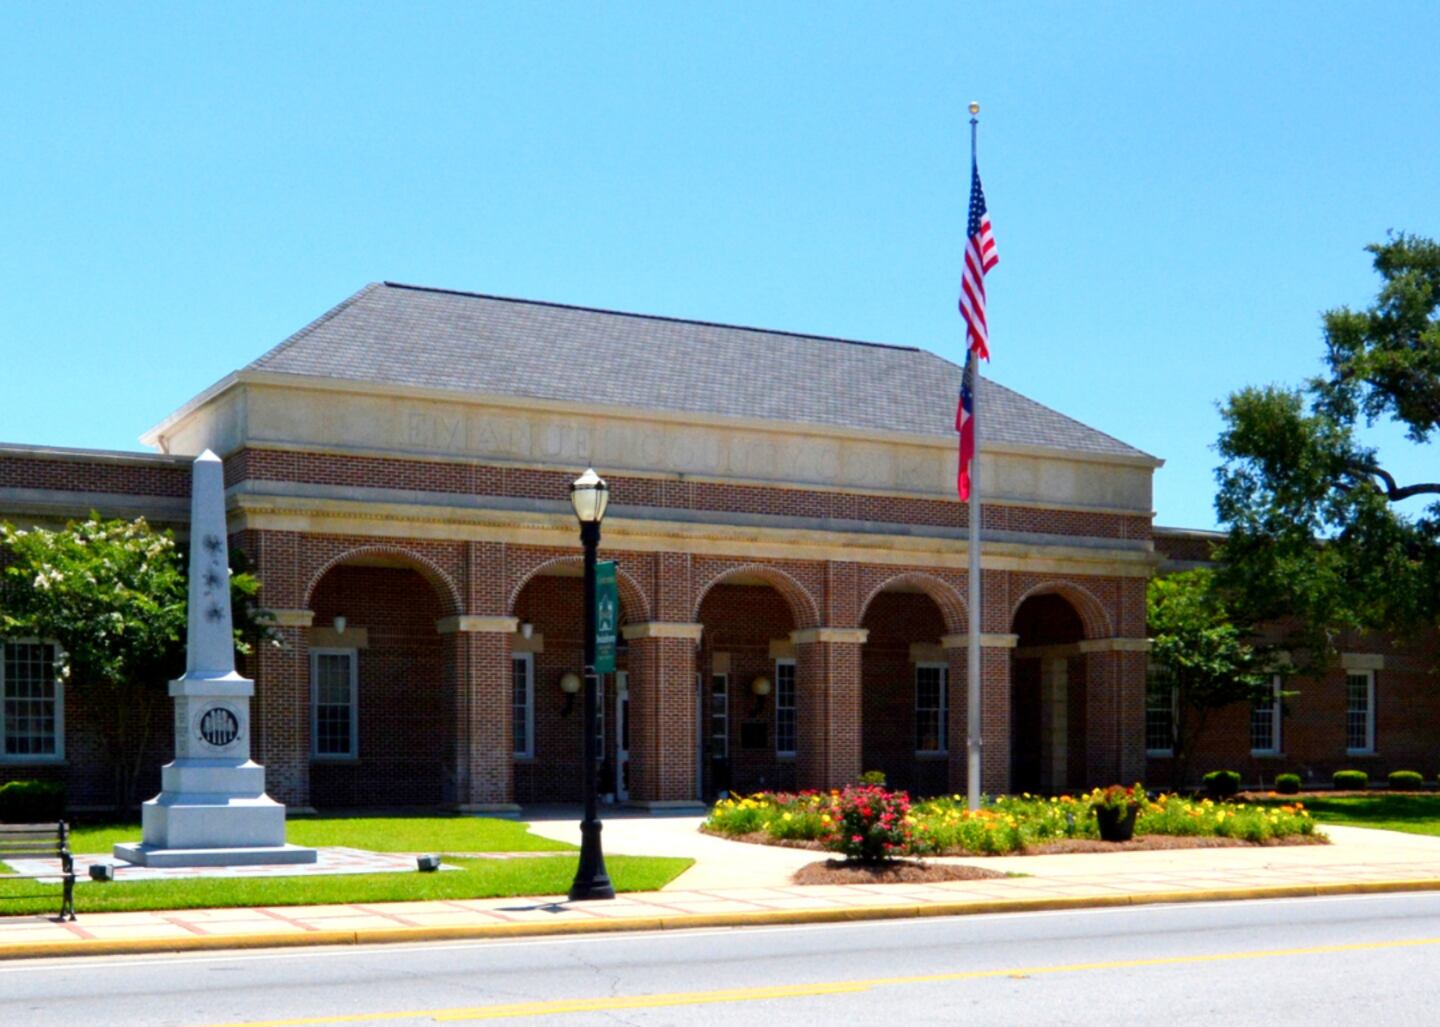
#14. Emanuel County
- Life expectancy: 70.9 years
--- 5.2 years lower than the state average

SevenMaps // Shutterstock
#13. Wilkinson County
- Life expectancy: 70.8 years
--- 5.3 years lower than the state average
Roberto Galan // Shutterstock
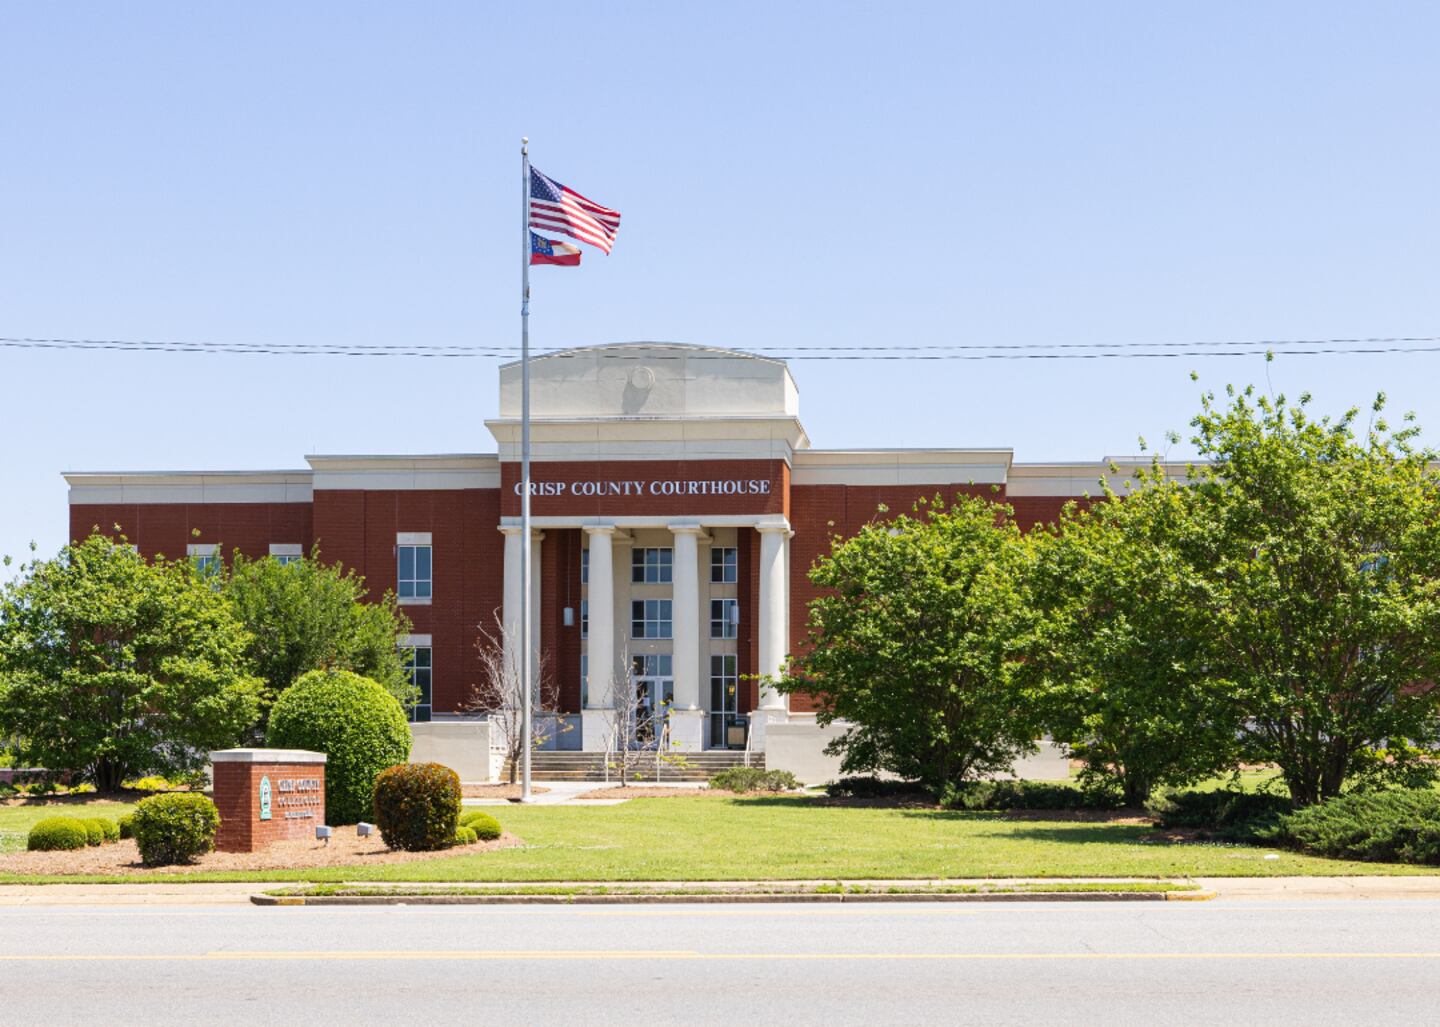
#12. Crisp County
- Life expectancy: 70.7 years
--- 5.4 years lower than the state average
Canva
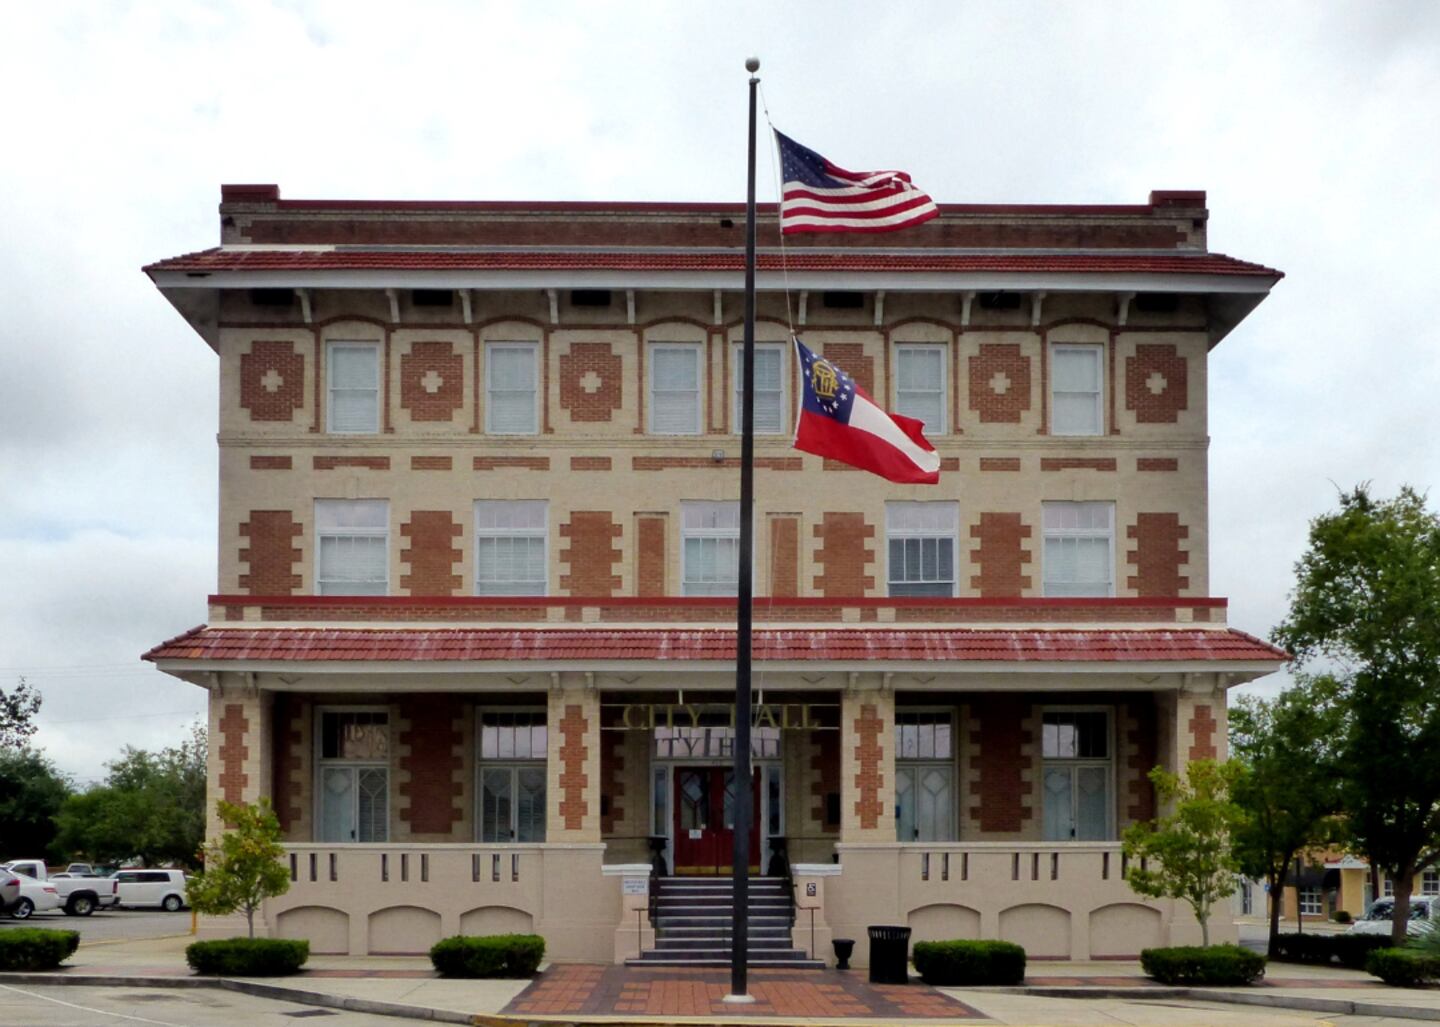
#11. Ware County
- Life expectancy: 70.4 years
--- 5.7 years lower than the state average
Canva
#9. Upson County (tie)
- Life expectancy: 70.3 years
--- 5.8 years lower than the state average

Conchi Martinez // Shutterstock
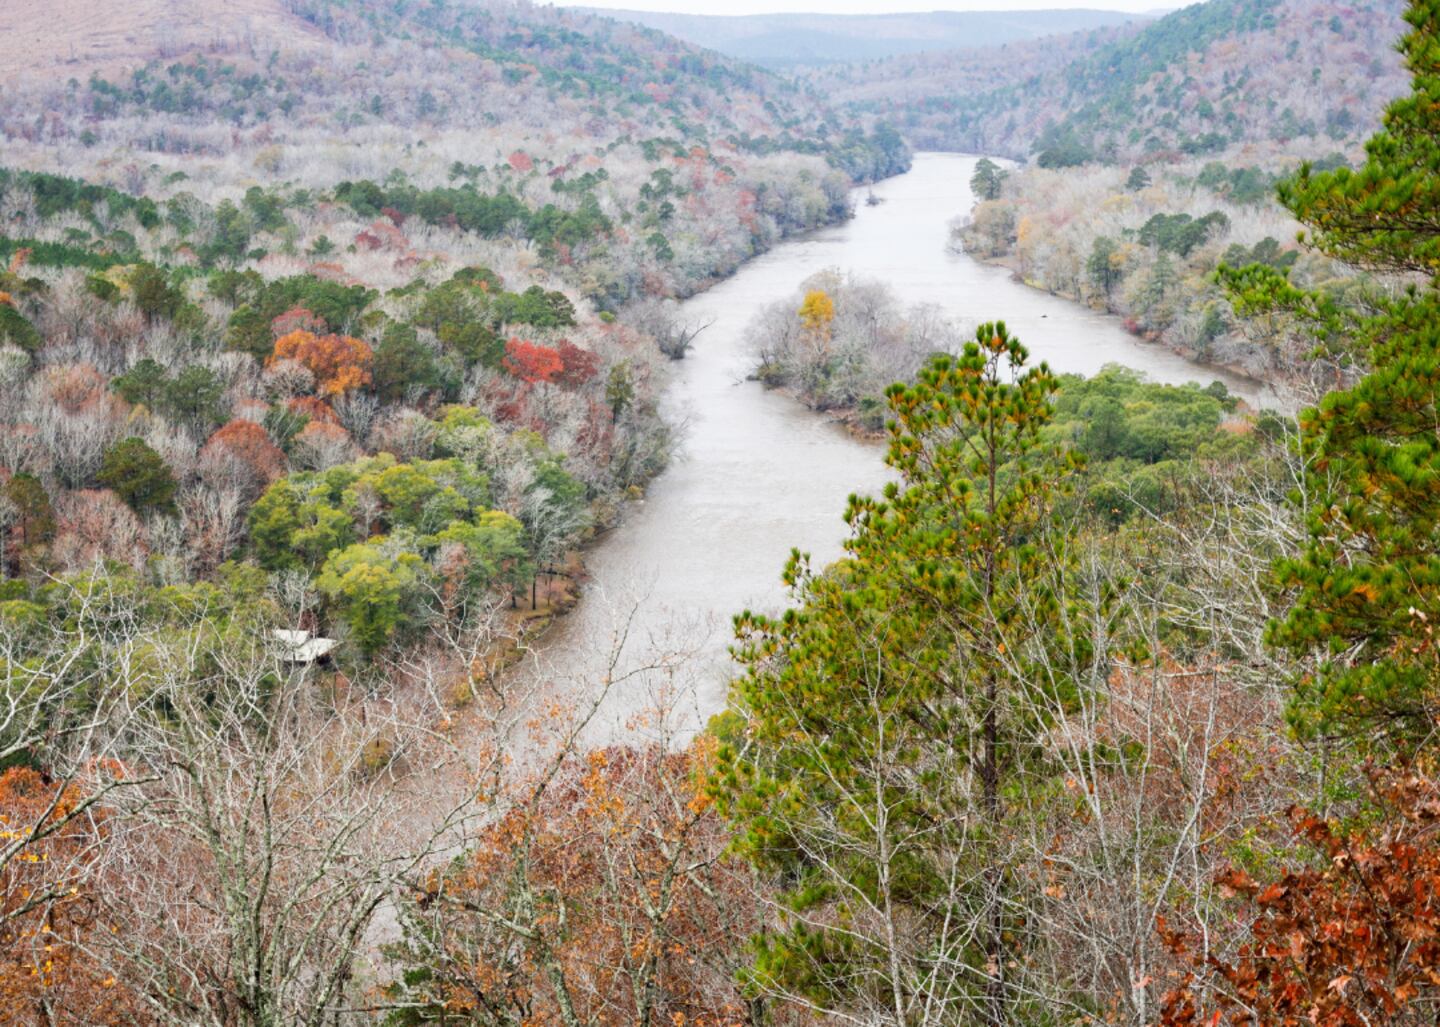
#9. Bacon County (tie)
- Life expectancy: 70.3 years
--- 5.8 years lower than the state average
Wirestock Creators // Shutterstock
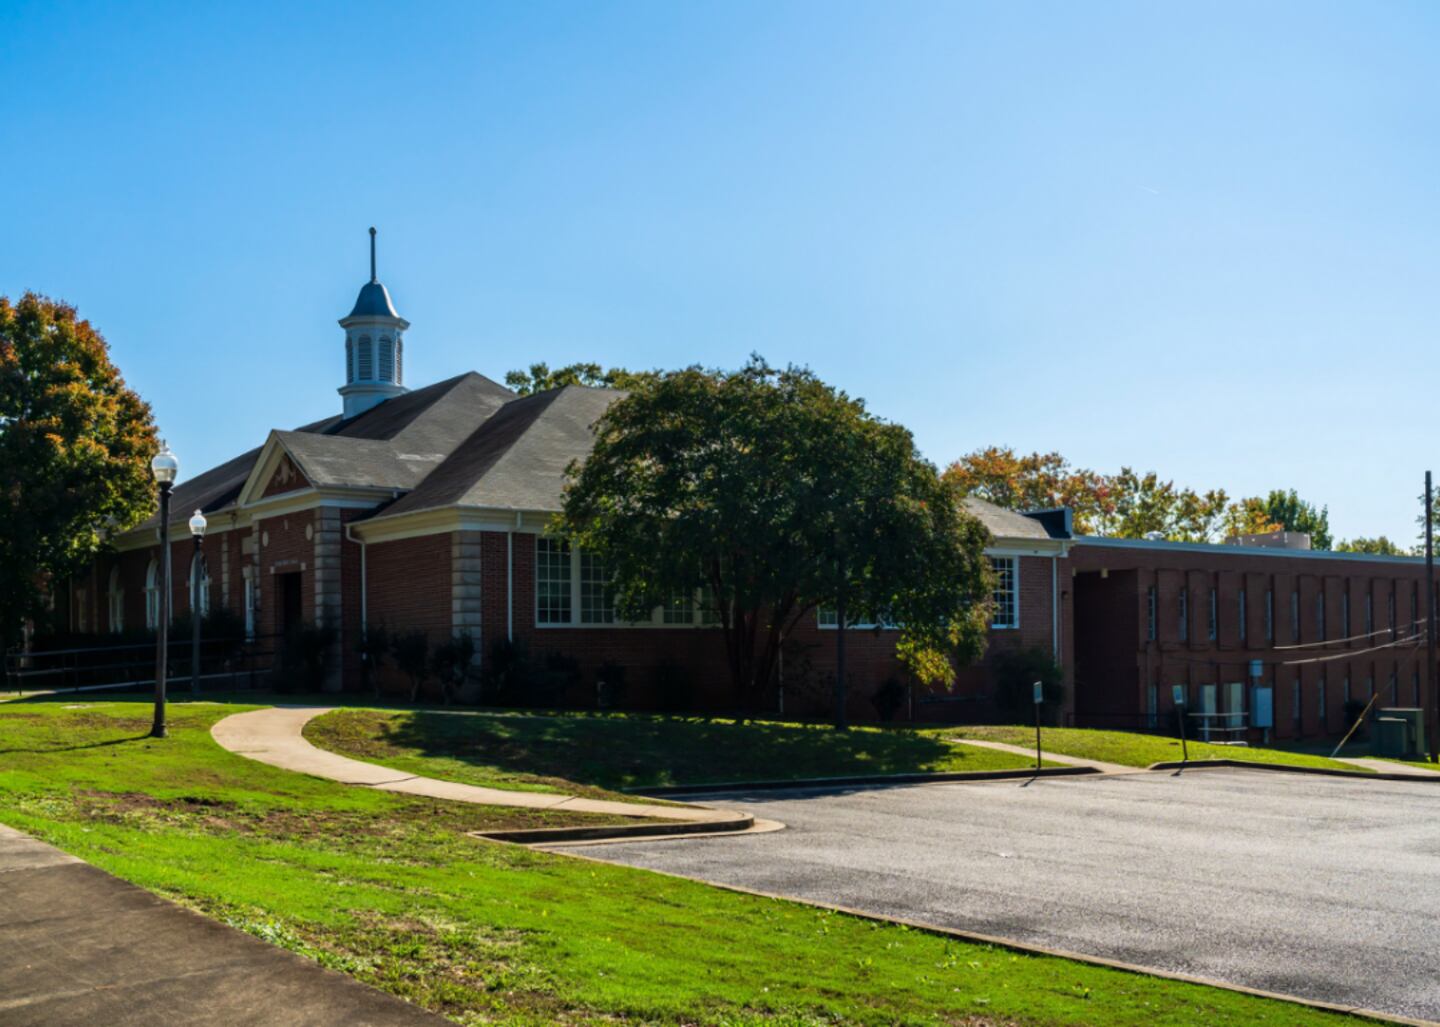
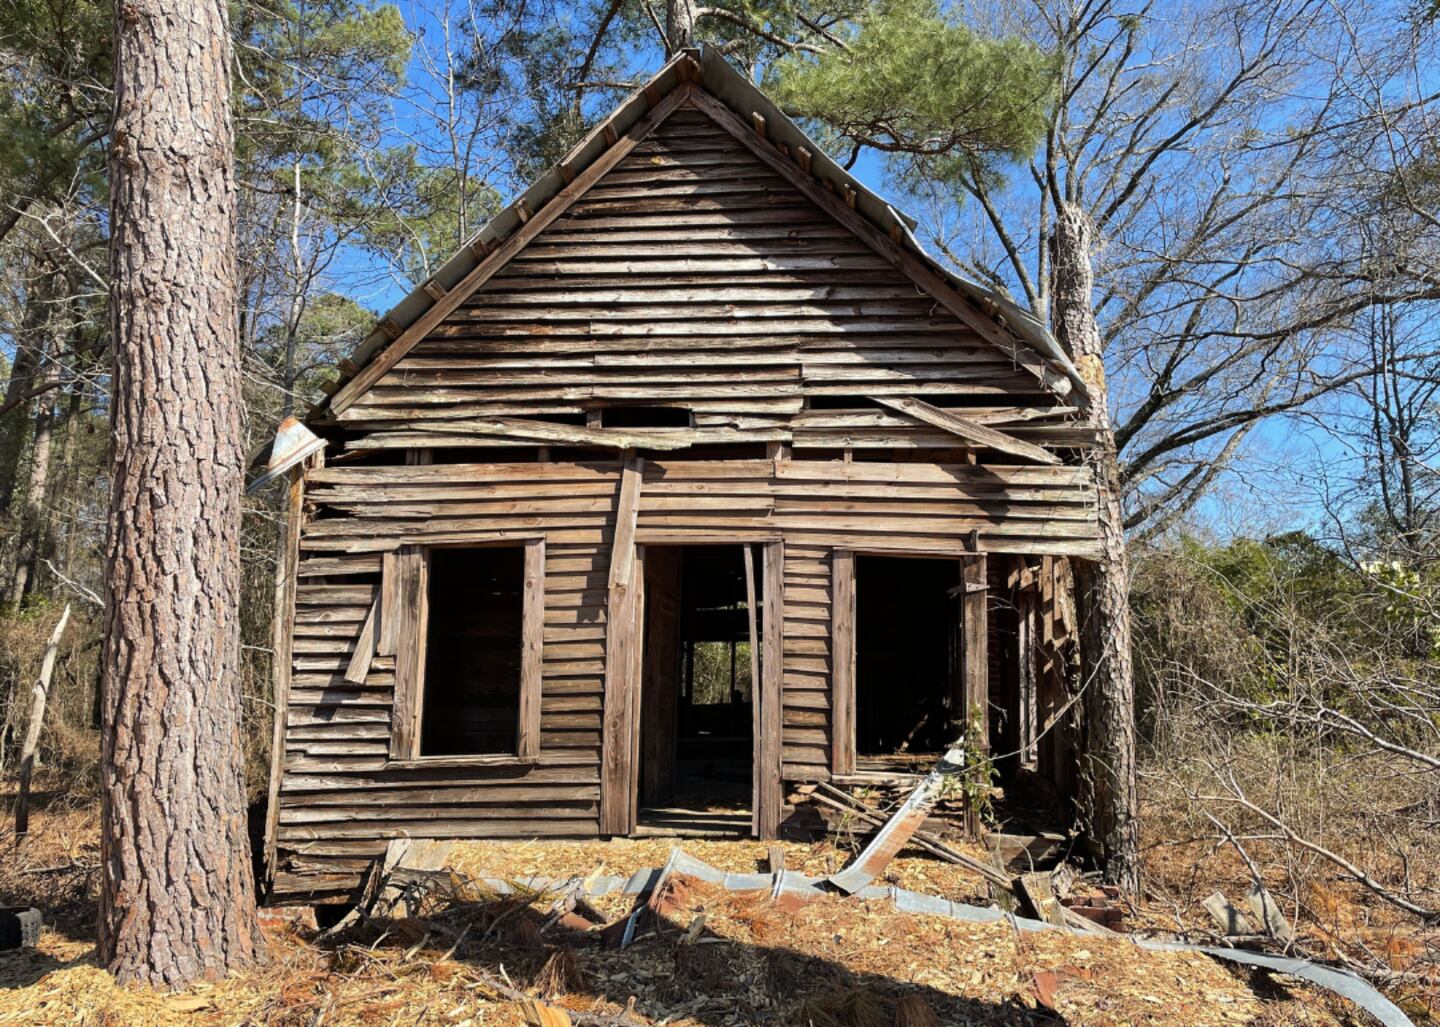
#7. Jefferson County (tie)
- Life expectancy: 70.2 years
--- 5.9 years lower than the state average
Canva
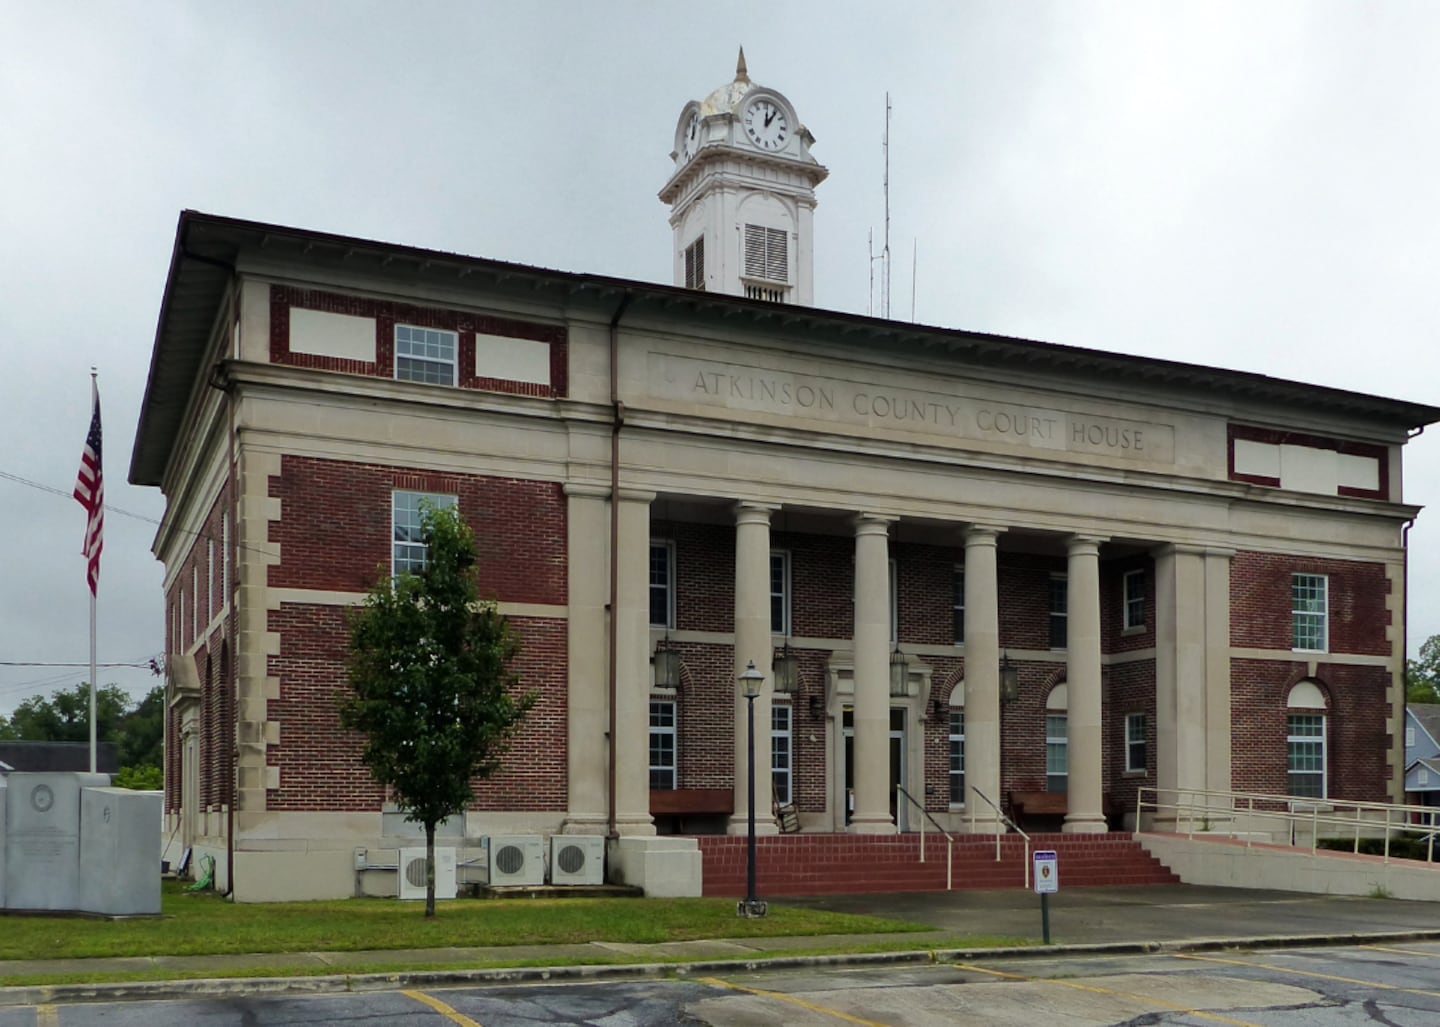
#7. Atkinson County (tie)
- Life expectancy: 70.2 years
--- 5.9 years lower than the state average
Canva
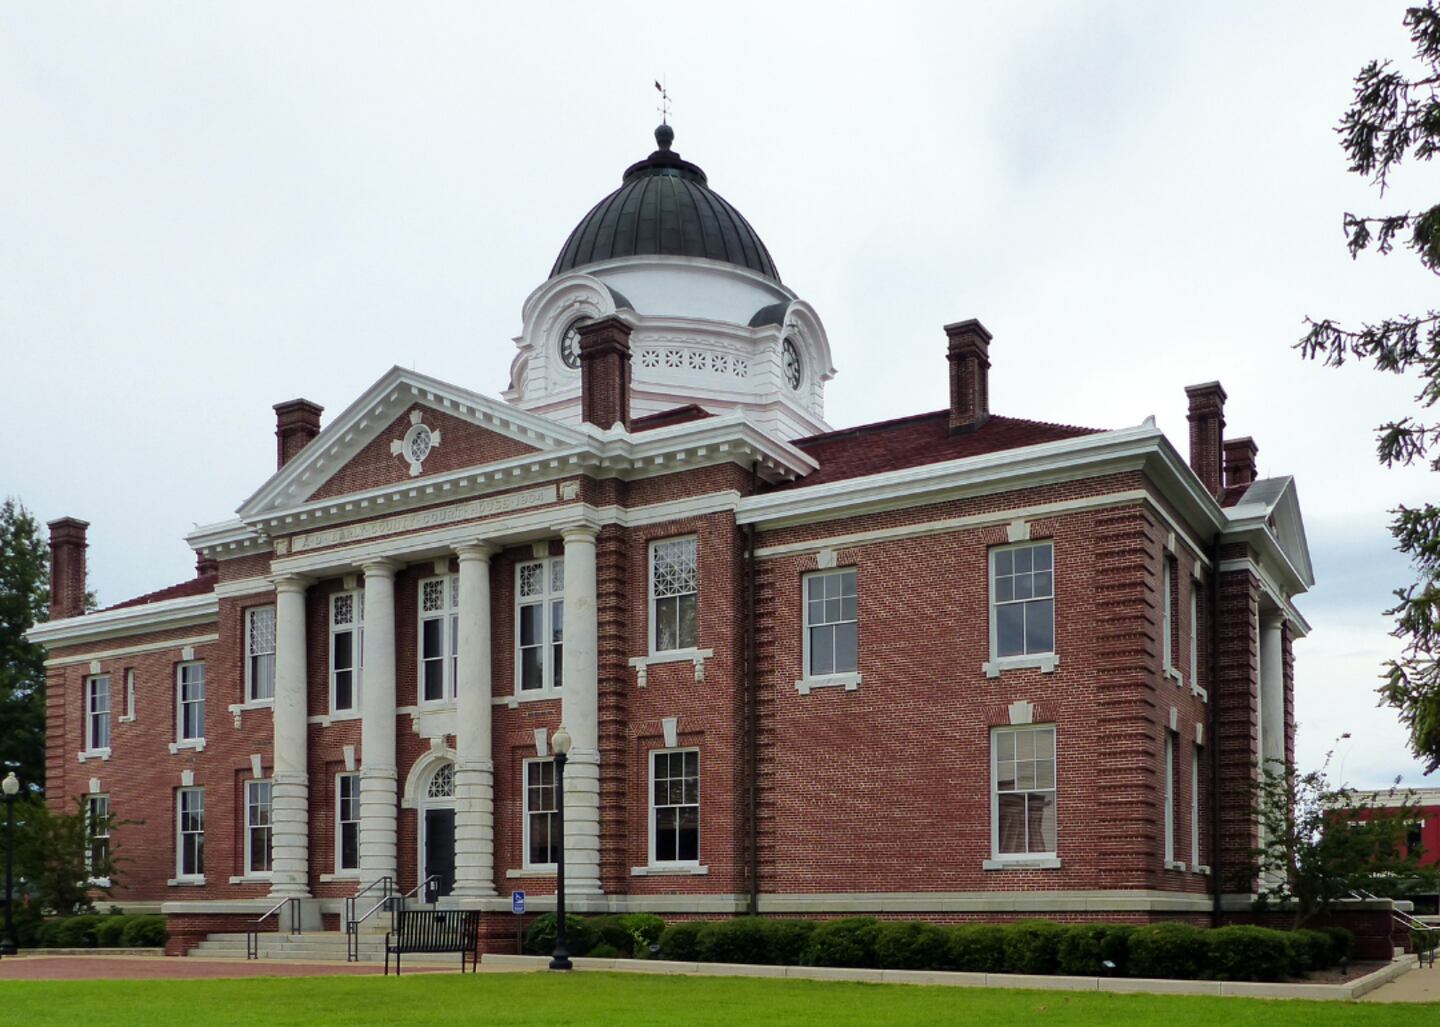
#6. Early County
- Life expectancy: 70.1 years
--- 6.0 years lower than the state average
Canva
#5. Clinch County
- Life expectancy: 69.8 years
--- 6.3 years lower than the state average

SevenMaps // Shutterstock
#3. Candler County (tie)
- Life expectancy: 69.6 years
--- 6.5 years lower than the state average
Roberto Galan // Shutterstock
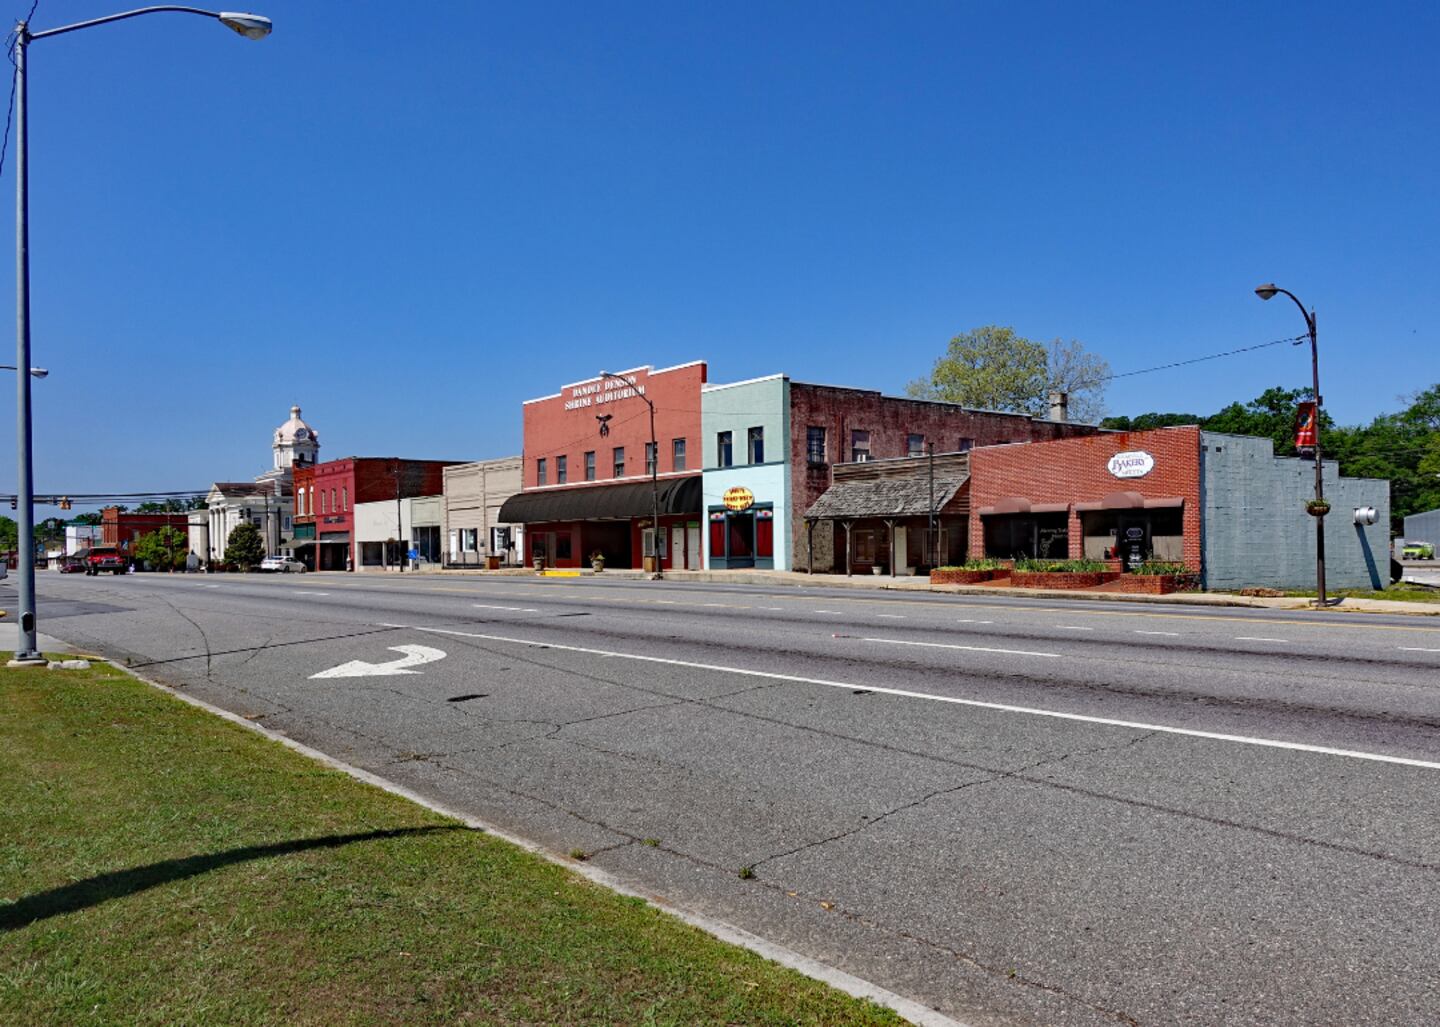
#3. Ben Hill County (tie)
- Life expectancy: 69.6 years
--- 6.5 years lower than the state average
Roberto Galan // Shutterstock
#2. Quitman County
- Life expectancy: 68.6 years
--- 7.5 years lower than the state average

Canva
#1. Miller County
- Life expectancy: 67.7 years
--- 8.4 years lower than the state average
This story features data reporting by Karim Noorani, writing by Kiersten Hickman, and is part of a series utilizing data automation across 49 states.


 Sign Up